
Hindcasts using the Rahmstorf 2007 model
On realclimate.org Rahmstorf critizes our model (Grinsted et al., 2009) on the basis that it has too low sensitivity (m/ºC) when extrapolated to a 65 m rise in sea level.
This is, however, to be expected as our model is only valid for small perturbations of sea level. It should not be extrapolated so carelessly. In fact you almost always run into problems when you extrapolate an empirical model far beyond the calibration interval. On this page I attempt to bring his critical comments into perspective by showing that the Rahmstorf model is quite poor at making hind-casts. The problem highlighted here also illustrates why it is necessary to take fast reacting contributors into account. Further i want to note that Stefans argument hinges on a cartoonish graph that does not convince me.
The Rahmstorf (2007) and Grinsted et al. (2009) models are both models that find a semi-empirical relationship between sea level and temperatures. We can attempt to assess the realism of the Rahmstorf (2007) model by making hindcasts using paleo-temperature reconstructions. Four such hindcast are shown in figure 1 on this page. The hindcasts can be compared against what we know about sea level for the past 2000 years. Here’s what the IPCC AR4 has to say about that:
Geological observations indicate that during the last 2,000 years (i.e., before the recent rise recorded by tide gauges), sea level change was small, with an average rate of only 0.0 to 0.2 mm yr–1 (see Section 6.4.3). The use of proxy sea level data from archaeological sources is well established in the Mediterranean. Oscillations in sea level from 2,000 to 100 yr before present did not exceed ±0.25 m, based on the Roman-Byzantine-Crusader well data (Sivan et al., 2004). Many Roman and Greek constructions are relatable to the level of the sea. Based on sea level data derived from Roman fish ponds, which are considered to be a particularly reliable source of such information, together with nearby tide gauge records, Lambeck et al. (2004) concluded that the onset of the modern sea level rise occurred between 1850 and 1950. Donnelly et al. (2004) and Gehrels et al. (2004), employing geological data from Connecticut, Maine and Nova Scotia salt-marshes together with nearby tide gauge records, demonstrated that the sea level rise observed during the 20th century was in excess of that averaged over the previous several centuries.
The joint interpretation of the geological observations, the longest instrumental records and the current rate of sea level rise for the 20th century gives a clear indication that the rate of sea level rise has increased between the mid-19th and the mid-20th centuries._
-IPCC AR4 (Bindoff et al., 2007; section 5.5.2.4)
Note that Rahmstorfs model is only valid for the initial response. However, he is arguing for a multi-millenia response time and ‘initial’ should be seen in this light.
Apparent lack of realism
The hind-casts generally show a strong increasing trend over the entire period. The Rahmstorf 2007 semi-empirical model is apparently inconsistent with paleo-evidence. The main source of disagreement is a drift in the model of 0.5-1 mm/yr. There are two possible explanations for the drift:
- There is a warm bias in all the temperature reconstructions of ~0.15-0.35 ºC. This could be within the uncertainties, but it still strikes me as implausible since it affects all the reconstructions with the same sign.
- The temperature intercept in the Rahmstorf model is wrong by the same amount. This is a much more plausible explanation considering the quality of the data used in the calibration.
Correcting for the drift however results in models that fits the data much worse (see figure 2). My interpretation is that the model needs to take the fast reacting contributors to sea level rise into account. In our Grinsted et al. (2009) paper we take the paleo-evidence into
account and find effective response times in the order of a few
centuries.
Extrapolating empirical models
The lack of realism in the hind casts illustrates the problems you run into when you extrapolate an empirical model far from the calibration interval. I think this brings the critical comments of my model on realclimate.org into perspective.
Little disagreement concerning sea level in 2100
I find it important to emphasize that this professional disagreement only have small implications for the sea level predictions for the year 2100 where we essentially agree. We can expect roughly a metre of sea level rise within this century. In my paper I examine how sensitive the projections are to changing the response time and we state “We find that projected 21st century sea level is virtually independent of response time (Fig. 6 and table 3) and that IPCC model projections are much too low even for millennia scale response times (Table 2).”. The drift-error highlighted on this page is severe for long-period hind casts, but is not so important for the 21st century sea level projections as temperatures are much further from equilibrium.
The interactive discussion of the differences between the two models can be found on realclimate.org.
References
- Grinsted, A., J. C. Moore, and S. Jevrejeva (2009), Reconstructing sea level from paleo and projected temperatures 200 to 2100 AD, Clim. Dyn., doi:10.1007/s00382-008-0507-2
- Rahmstorf, S., A. Cazenave, J. A. Church, J. E. Hansen, R. F. Keeling, D. E. Parker & R. C. J. Somerville, Recent Climate Observations Compared to Projections, Science 316, p709, DOI: 10.1126/science.1136843 (2007)
- Esper, J., E.R. Cook, and F.H. Schweingruber, 2002, Low-Frequency Signals in Long Tree-Ring Chronologies for Reconstructing Past Temperature Variability, Science, Volume 295, Number 5563, 22 March 2002.
- Jones, P.D. and M.E. Mann. 2004. Climate Over Past Millennia. Reviews of Geophysics 42, RG2002. http://www.ncdc.noaa.gov/paleo/pubs/jones2004/jones2004.html
- Mann, M.E. and P.D. Jones, 2003, Global Surface Temperatures over the Past Two Millennia, Geophysical Research Letters, Vol. 30, No. 15, 1820, August 2003. doi: 10.1029/2003GL017814.
- Moberg, A., Sonechkin, D. M., Holmgren, K., Datsenko, N. M. & Karlén W. Highly variable Northern Hemisphere temperatures reconstructed from low- and high-resolution proxy data Nature, 433, 613-617 (2005)
- Sivan, D., et al., 2004: Ancient coastal wells of Caesarea Maritima, Israel, an indicator for sea level changes during the last 2000 years. Earth Planet. Sci. Lett., 222, 315–330.
- Lambeck, K., et al., 2004: Sea level in Roman time in the Central Mediterranean and implications for recent change. Earth Planet. Sci. Lett., 224, 563–575.
- Donnelly, J.P., P. Cleary, P. Newby, and R. Ettinger, 2004: Coupling instrumental and geological records of sea-level change: Evidence from southern New England of an increase in the rate of sea-level rise in the late 19th century. Geophys. Res. Lett., 31(5), L05203, doi:10.1029/2003GL018933.
- Gehrels, W.R., et al., 2004: Late Holocene sea-level changes and isostatic crustal movements in Atlantic Canada. Quat. Int., 120, 79–89 Bindoff, N.L., J. Willebrand, V. Artale, A, Cazenave, J. Gregory, S. Gulev, K. Hanawa, C. Le Quéré, S. Levitus, Y. Nojiri, C.K. Shum, L.D. Talley and A. Unnikrishnan: Observations: Oceanic Climate Change and Sea Level. In: Climate Change 2007: The Physical Science Basis. Contribution of Working Group I to the Fourth Assessment Report of the Intergovernmental Panel on Climate Change [Solomon, S., D. Qin, M. Manning, Z. Chen, M. Marquis, K.B. Averyt, M. Tignor and H.L. Miller (eds.)]. Cambridge University Press, Cambridge, United Kingdom and New York, NY, USA. (2007)
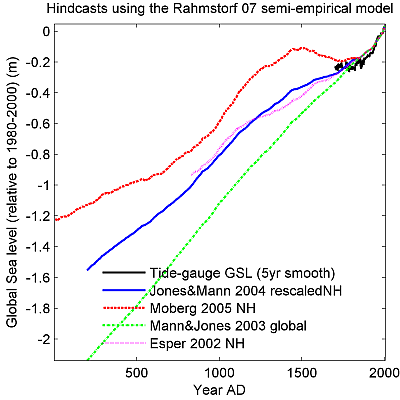
Figure 1: The Rahmstorf (2007) model shows a considerable drift when applied to temperature reconstructions.
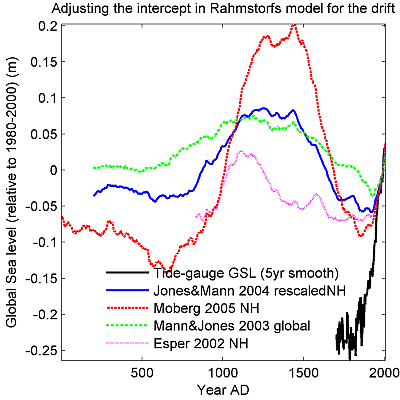
Figure 2: Adjusting the Rahmstorfs model to correct for the drift gives results in poor fits to the tide gauge data. My interpretation is that you simply need to account for the fast reacting components to account for this.
Please note that this figure still uses the 3.4 mm/yr/ºC found in Rahmstorf (2007). However, the slope should change to if the intercept change if you want to keep the good fit. If you want to reach the low values in 19th century then you need to adjust the slope to ~10 mm/yr/ºC - but this results in a very poor fit for the 20th century. The Rahmstorf (2007) model can not fit the entire period when it is corrected for the drift. The model fit can be dramatically improved by using a relatively short (century scale) response time (as in Grinsted et al., 2009).
Technical comment: The drift-removal was done by setting the temperature intercept to the mean temperature prior to 1800.