Hurricane surges in tide gauges
The hurricane surge index was constructed by extracting the hurricane surge signal from tide gauge records. This involved some pre-filtering of the tide gauge data. This page illustrates a number of these steps on a short section of the 2005 data recorded at the Pensacola tide gauge.
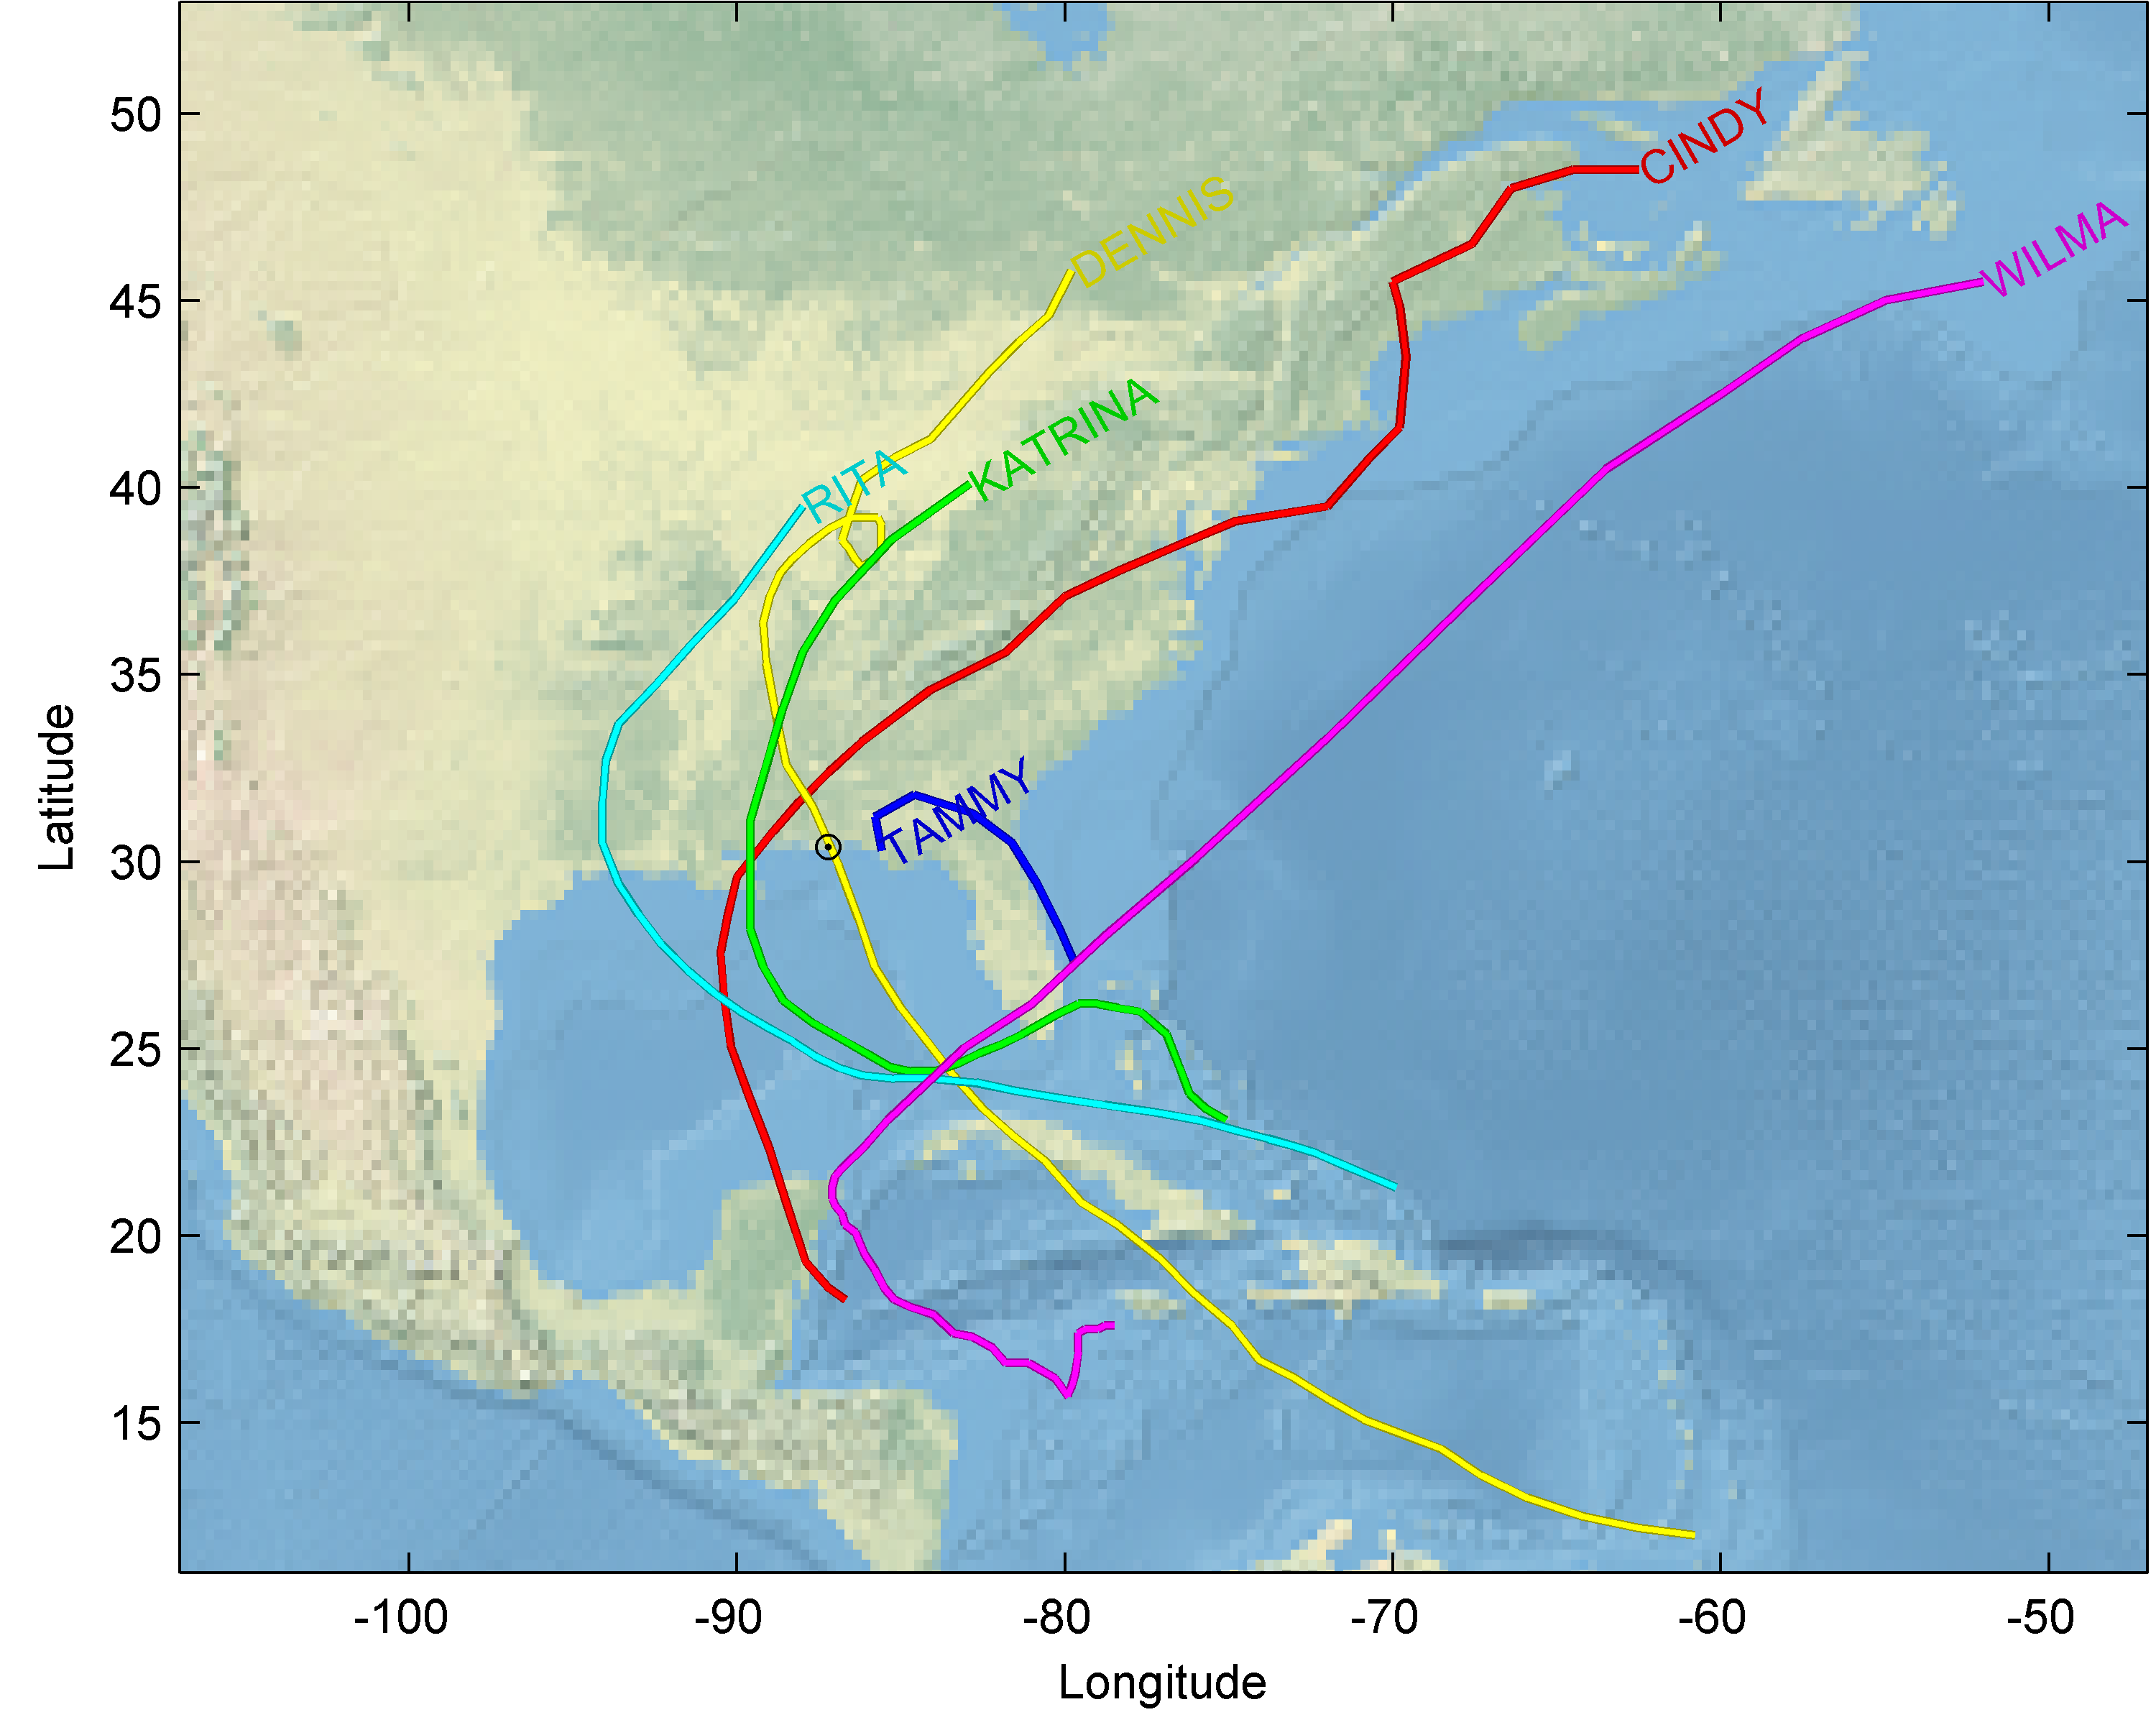
The raw hourly data is plotted in the first row. The date of first landfall for named storms are written above the plot and colorcoded to correspond to the paths plotted in the map.
We see that clearly all the named storms give rise to a sea level anomaly. I first take daily averages. This strongly mutes the tidal signals, and the surge signals stand out much more clearly. We see that Wilma that hit the florida pan-handle caused a sea level drop at Pensacola. This is typical of cyclones hitting to the east of a tide gauge. The off shore winds of the cyclone cause this drop in sea level. Daily average surge is also much less sensitive to local geometry. I.e. the tide gauge becomes representative of a much greater part of the coastline than it would have otherwise.
We then take day-to-day differences. This is essentially a highpass filter and removes the slow seasonal trends visible in the plot and also long term sea level rise. We take absolute values because we want to detect important events like that from Wilma.
We then downsample to daily values, decluster, and take weekly maxima. This is because we want to only have one value per event, so that we can talk about frequencies.
In addition to this processing then we deseasonalize and combine the resulting records from 6 tidegauges into a single surge index record. Deseasonalizing is necessary to justify the type of GEV model that is used in this study. The alternative would be to build a much more complicated statistical model that includes parameters to model the seasonal cycle.
See also:
- Homogeneous record of Atlantic hurricane surge threat since 1923
- Projected Atlantic hurricane surge threat from rising temperatures
!