Review of global glacier volume estimates
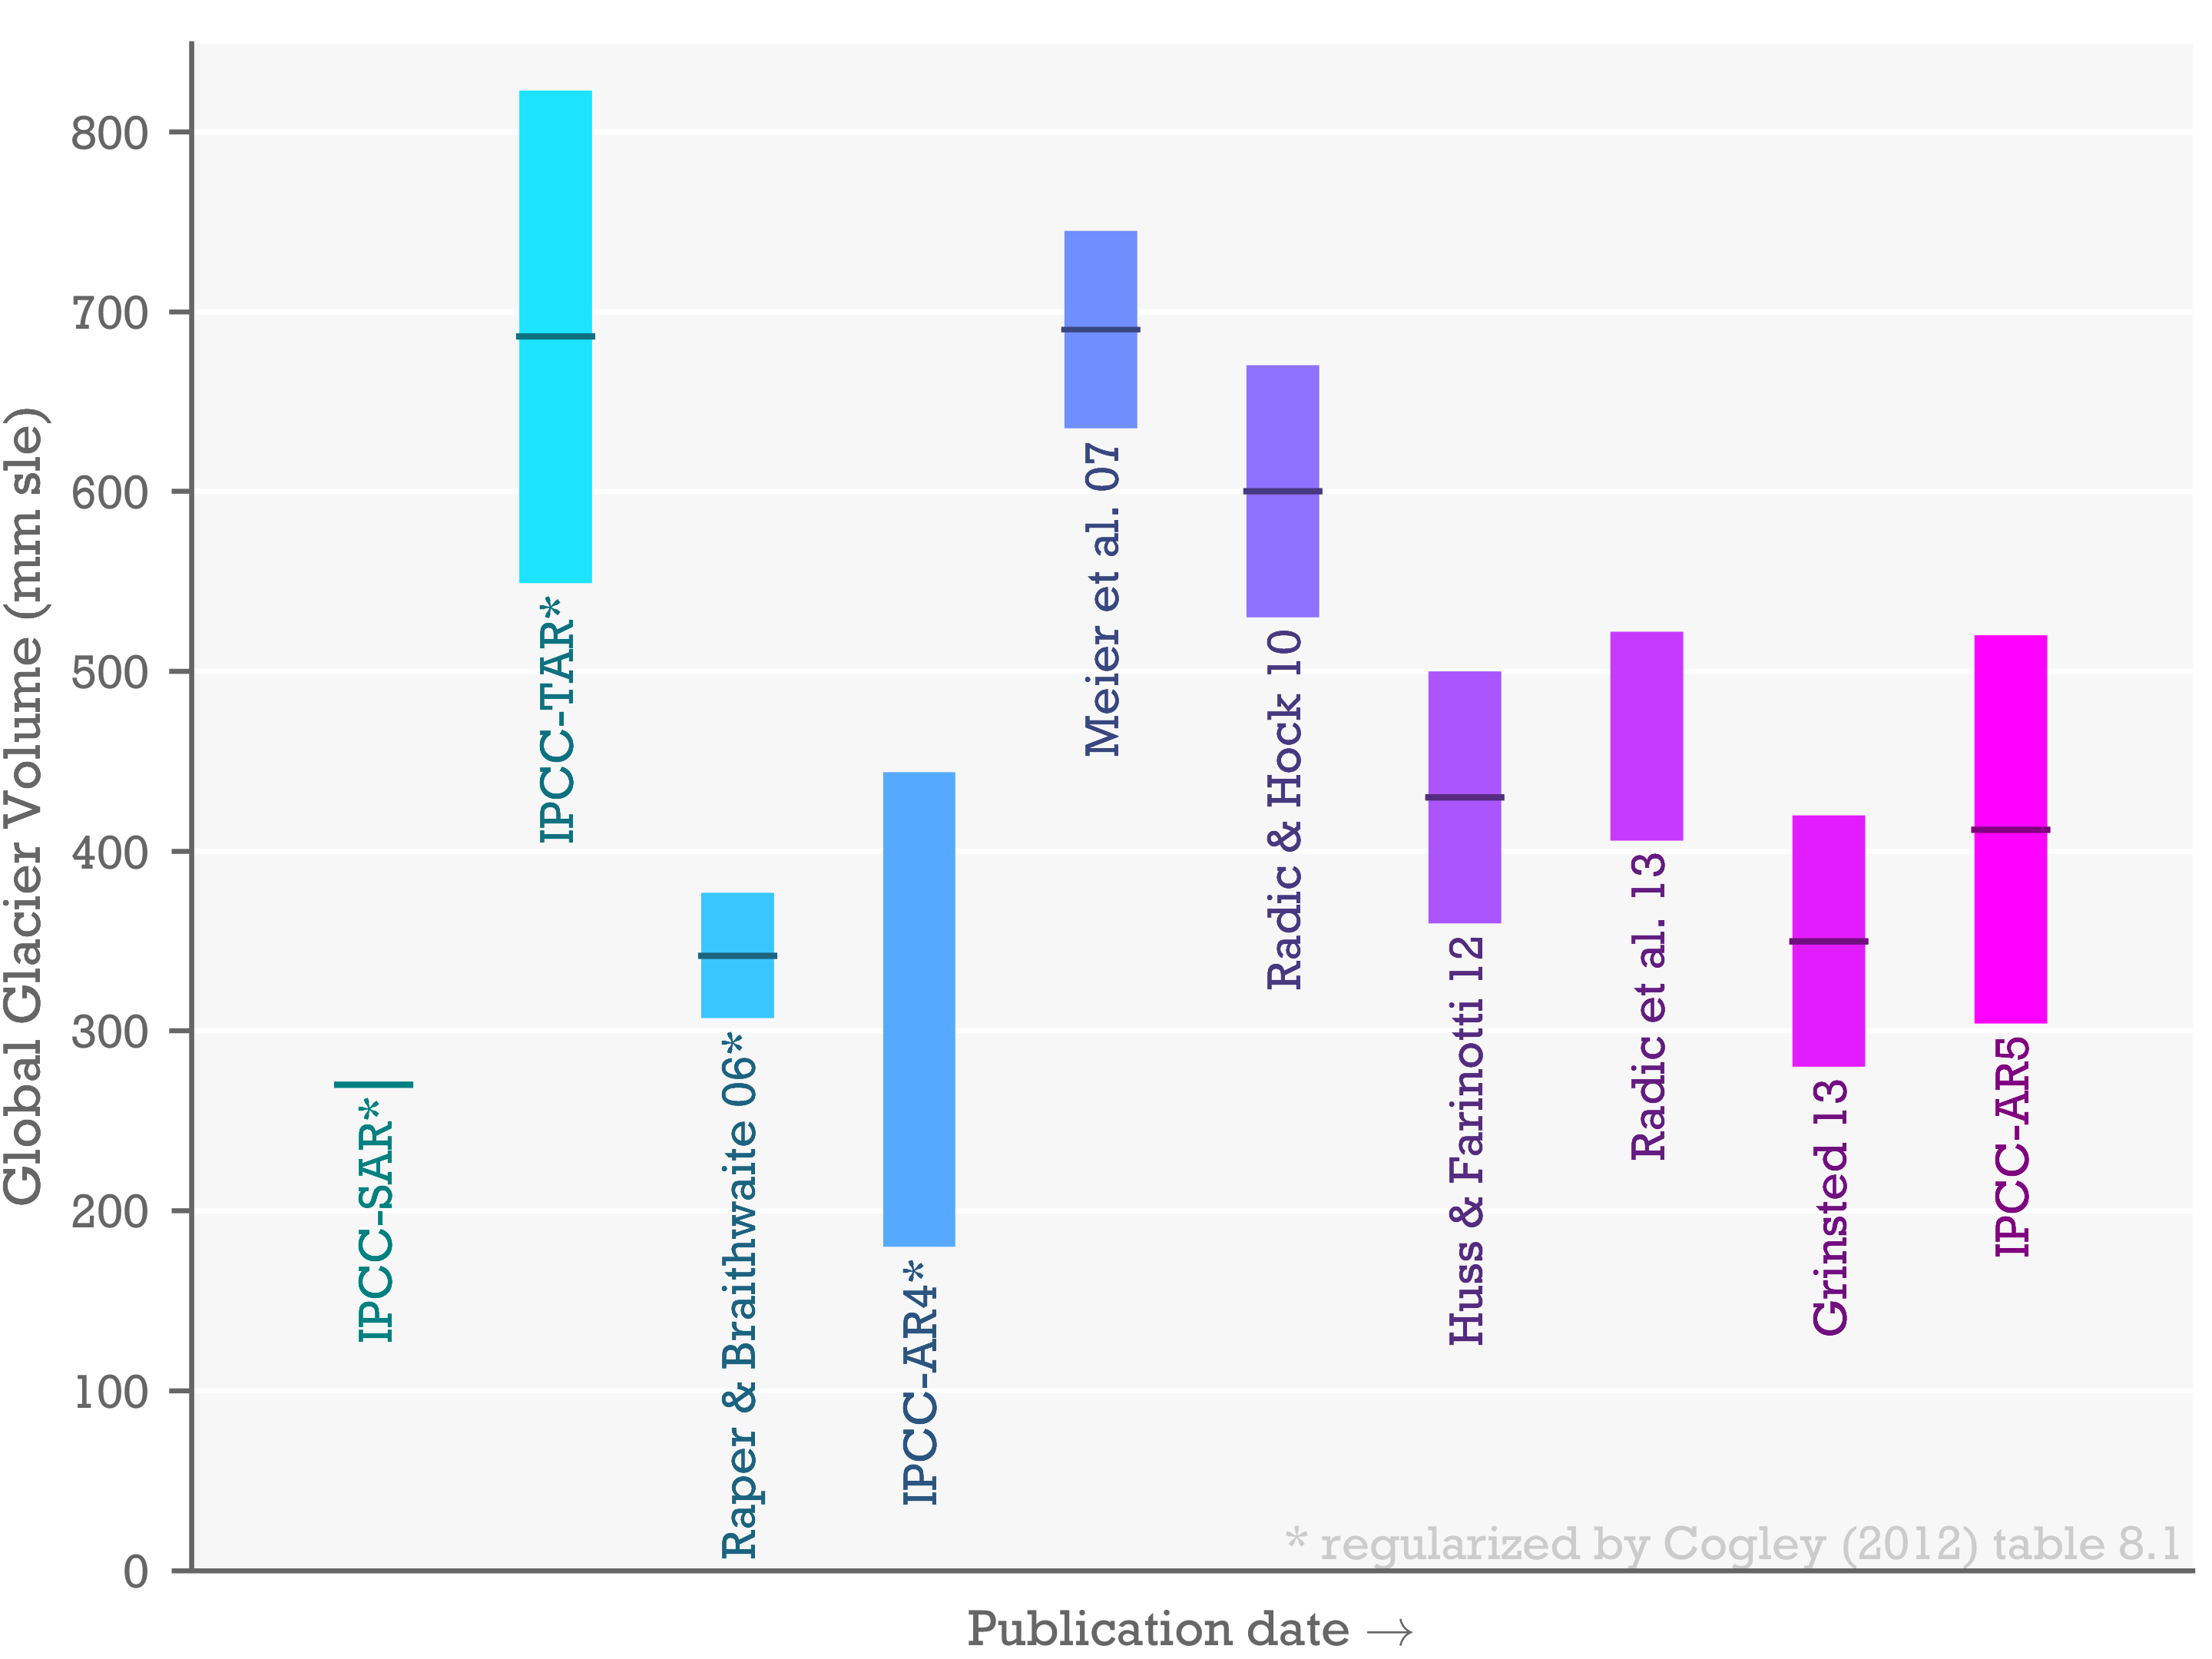
This is an updated version of the regularized global glacier volume estimates from Cogley (2012). I have included 2 new estimates: one by myself (G13) and another from Huss and Farinotti (HF12). These two papers are the first to use the new Randolph Glacier Inventory (they used v2).
Less ice in the world means a smaller potential contribution to sea level rise. That is the good news. The bad news is that it also implies thinner glaciers. Thinner glaciers will melt more easily (the rate of glaciated area loss will be quicker).
In my paper I argue that there is a positive bias in Radic and Hock 2010, and by extension also in Radic et al. 2013. You will have to read the paper to judge whether you agree with that assessment (I have also written this rant about the subject). The HF12 paper uses a new innovative method for estimating thickness grids of individual glaciers and from that calculates volume, where as I use a more traditional statistical approach.
See also this overview of recent glacier projections.
References:
Cogley, J.G. (2012), The future of the world’s glaciers. In: The Future of the World’s Climate. A. Henderson-Sellers and K. McGuffie (eds) Elsevier DOI: 10.1016/B978-0-12-386917-3.00008-7
Grinsted, A. (2013): An estimate of global glacier volume, The Cryosphere, 7, 141–151, doi:10.5194/tc-7-141-2013 [link]
Huss, M., and D. Farinotti (2012), Distributed ice thickness and volume of all glaciers around the globe, J. Geophys. Res., 117, F04010, doi:10.1029/2012JF002523
Radić, V., Bliss, A., Beedlow, A. C., Hock, R., Miles, E., & Cogley, J. G. (2013). Regional and global projections of twenty-first century glacier mass changes in response to climate scenarios from global climate models. Climate Dynamics, 42(1-2), 37-58. [Link]
Figure caption: Recent estimates of global glacier volume.
Please note that the scaling laws in Radic and Hock (2010), and Radic et al. (2013) appear to be biased high when tested on all observations available to me (see Grinsted, 2013). The vertical bar plotted for Radic et al 2013 is not an uncertainty, but two alternative estimates given in their paper (which is actually a paper about projections).
**Speculation of what AR5 will say. **
What will AR5 use? I guess they will base it on the three most recent estimates. So i guess they will say something like 0.40 m +/- 0.15 m.
[Update 10Nov2014: AR5 said 412mm and gave a min-max uncertainty of ±10cm. Graph has been updated to reflect this]