We construct the probability density function of global sea level at 2100, estimating that sea level rises larger than 180 cm are less than 5% probable. An upper limit for global sea level rise of 190 cm is assembled by summing the highest estimates of individual sea level rise components simulated by process based models with the RCP8.5 scenario.
The agreement between the methods may suggest more confidence than is warranted since large uncertainties remain due to the lack of scenario-dependent projections from ice sheet dynamical models, particularly for mass loss from marine-based fast flowing outlet glaciers in Antarctica. This leads to an intrinsically hard to quantify fat tail in the probability distribution for global mean sea level rise. Thus our low probability upper limit of sea level projections cannot be considered definitive. Nevertheless, our upper limit of 180 cm for sea level rise by 2100 is based on both expert opinion and process studies and hence indicates that other lines of evidence are needed to justify a larger sea level rise this century.
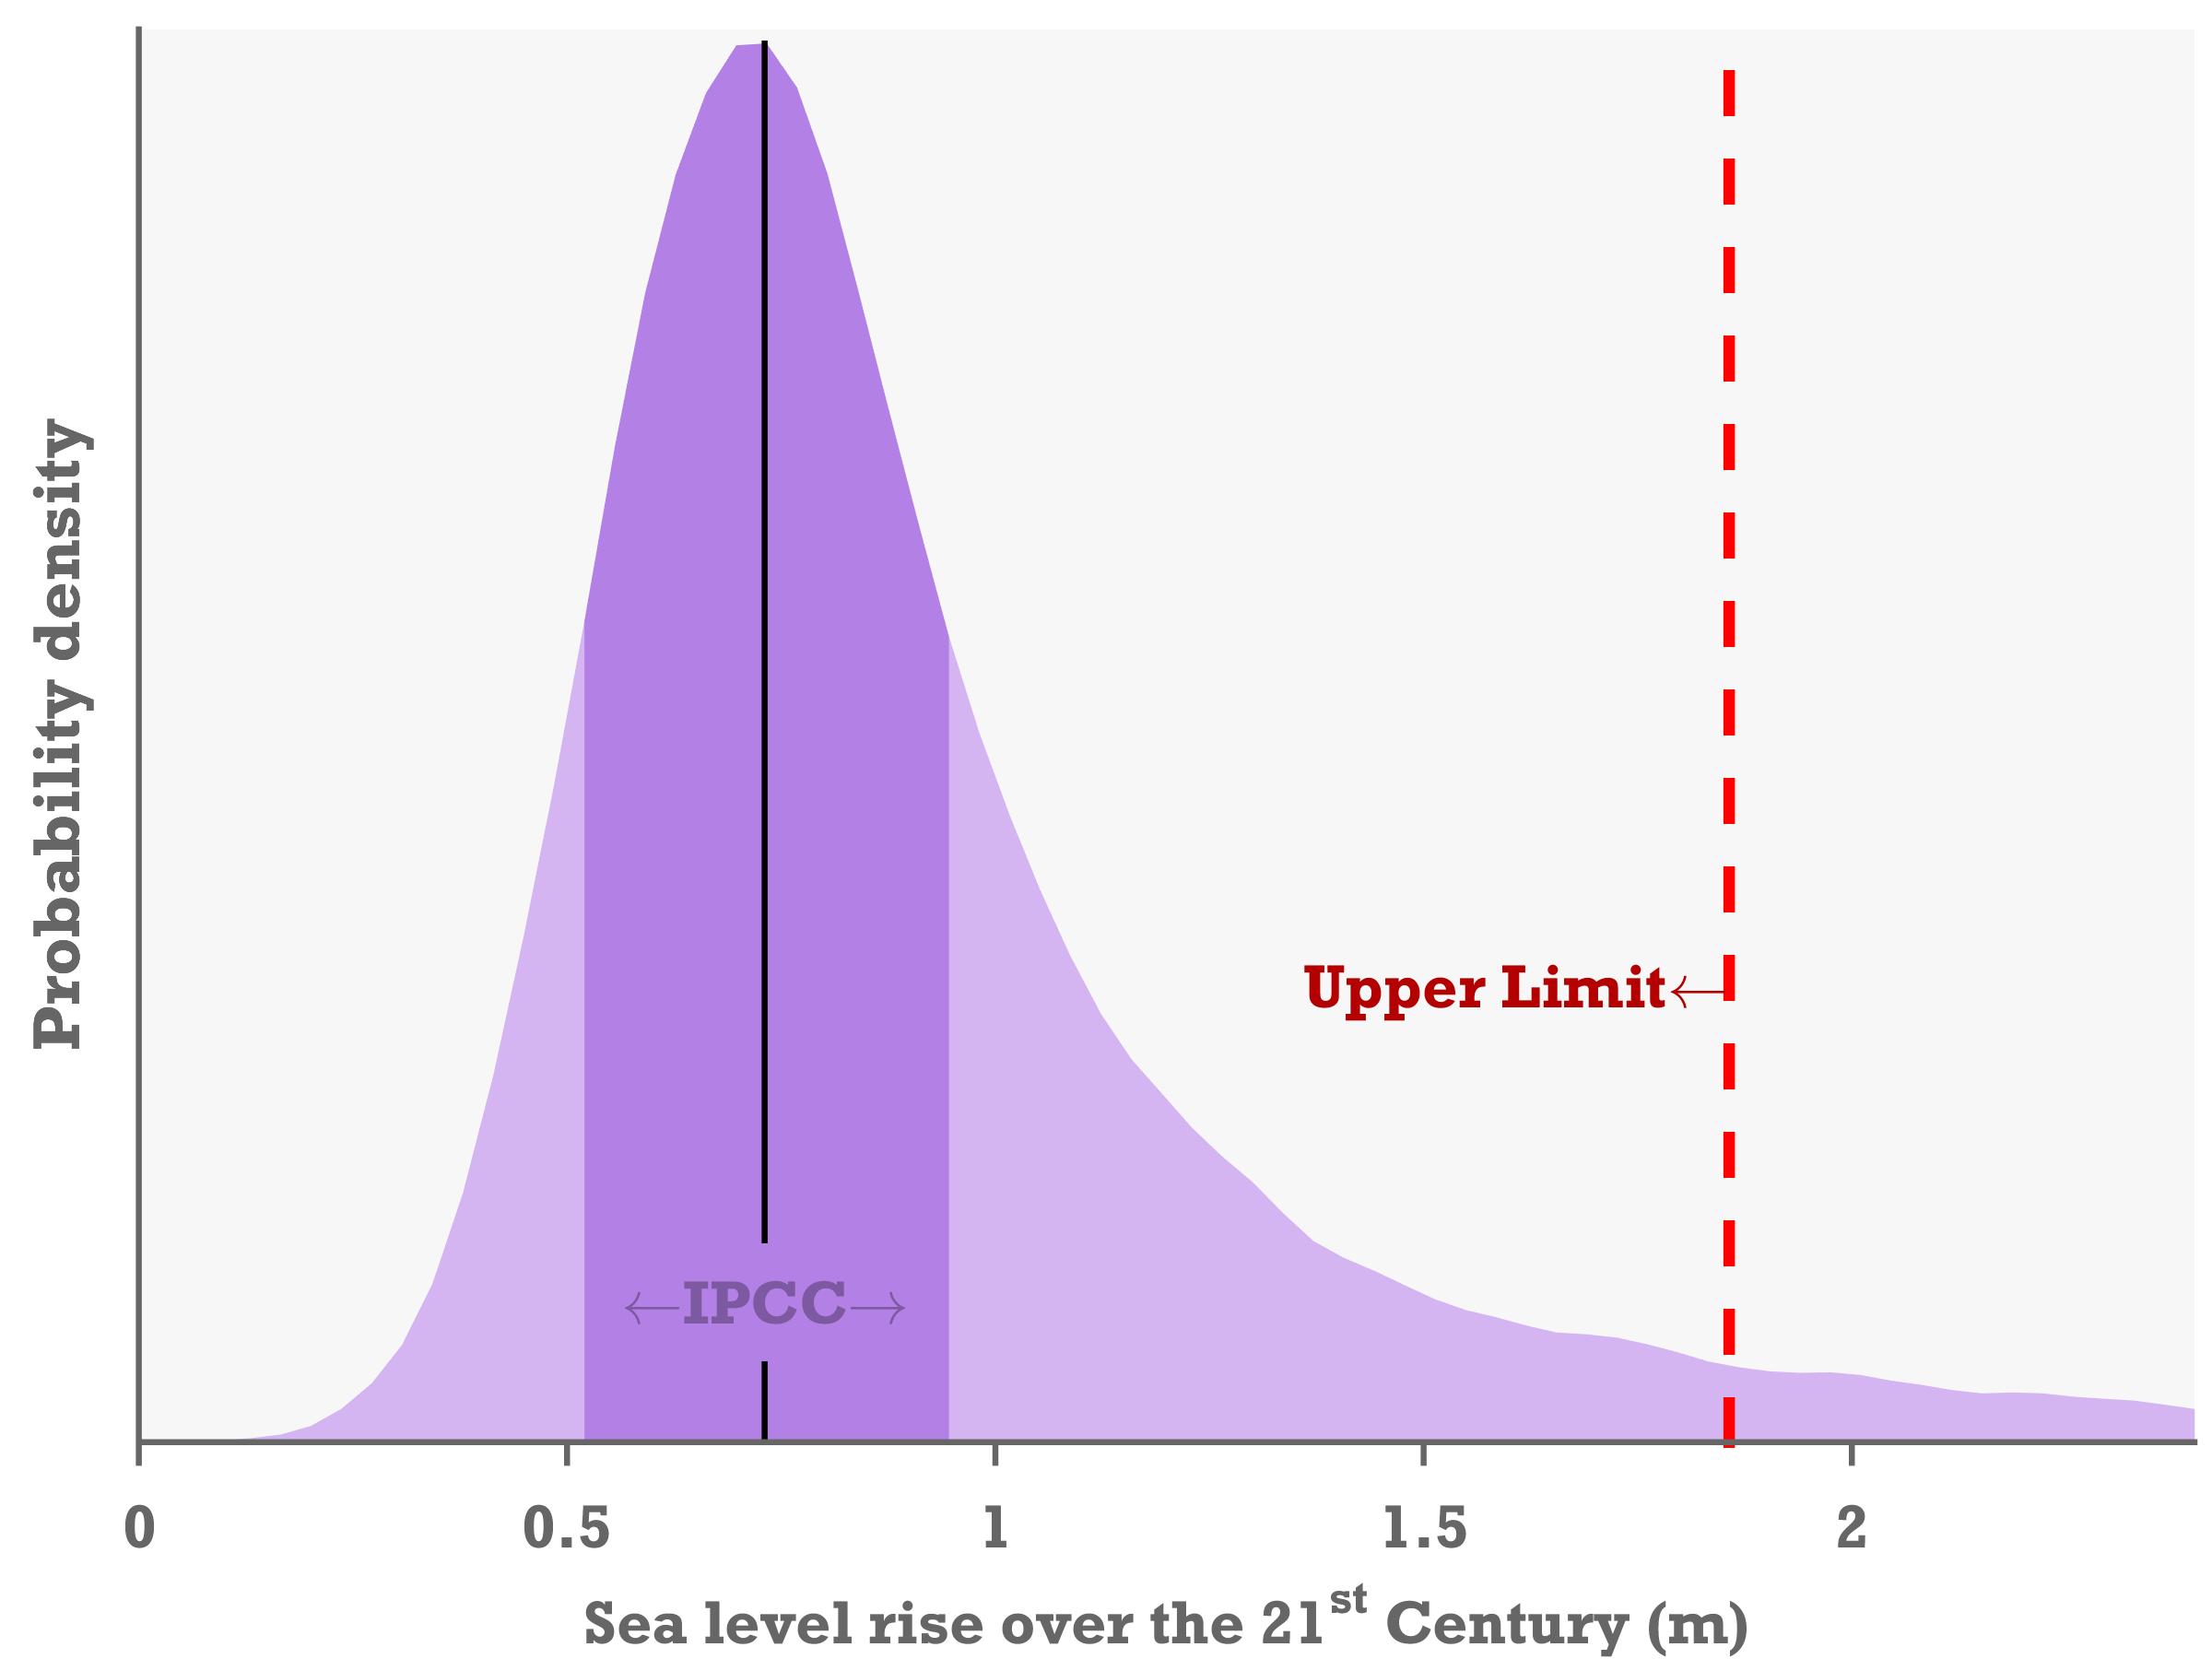
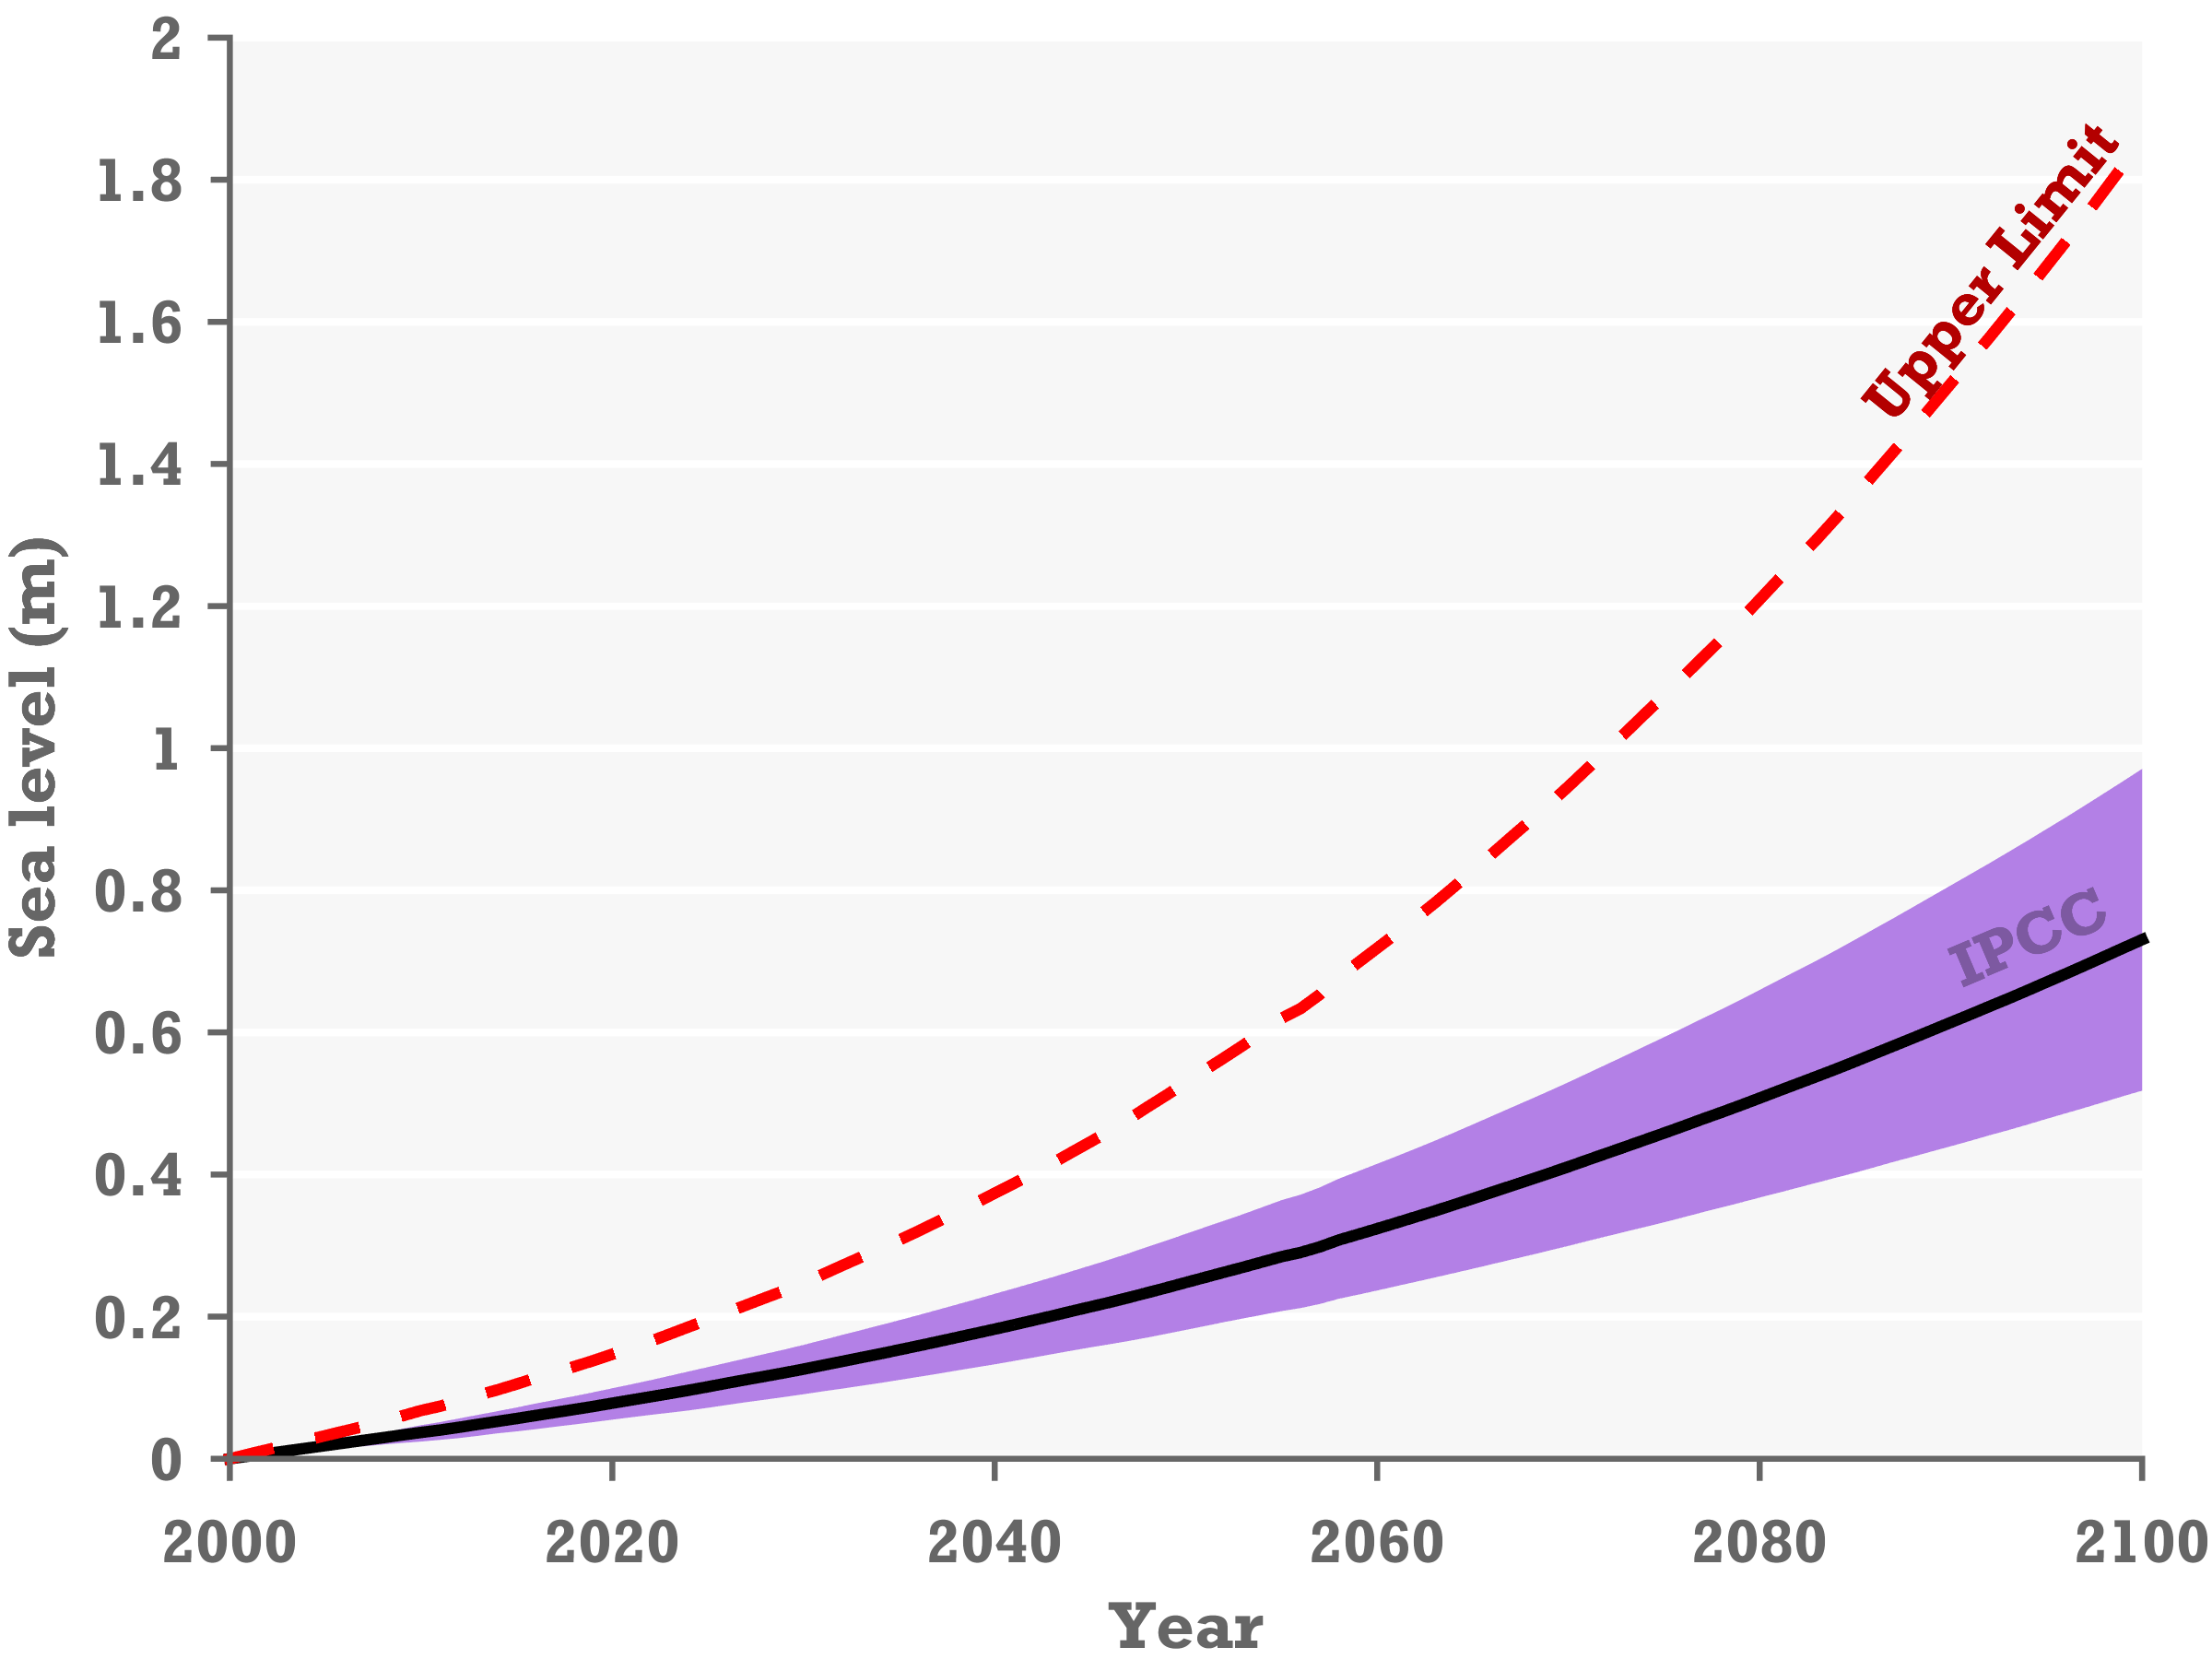
Graphical representation of the full uncertainty in the sea level projections over the 21st century. It is found that there is 95% certainty that sea level rise will not exceed 1.8m this century (red). Darker purple shows the likely range of sea level rise as projected in the IPCC fifth assessment report under a scenario with rising emissions throughout the 21st century (RCP8.5).
Background
The IPCC did not provide an upper limit or worst case scenario for sea level rise this century, but only a likely range of future sea level rise. In IPCC jargon “likely range” means that there is 33% chance that sea level rise will fall outside this range, and thus the IPCC high-end estimate is not a worst case scenario. I have criticized how this was communicated by the IPCC, because I thought that it was pretty clear that it would be misunderstood thus. The main uncertainty is the future rate of ice sheet mass loss and in particular the risk of a collapse of parts of the Antarctic ice sheet. This is particular challenging to model, and IPCC write that a collapse may cause sea level to rise faster than the ’likely range’, but also that this risk is essentially impossible to model (paraphrased). In order to quantify the risk we therefore had to look to other lines of evidence, and here we looked at an expert elicitation which quantified the subjective uncertainty within the community of ice-sheet experts. We combined this with the IPCC numbers for the other contributions to sea level rise. The strength of this approach is that this is not just our view of the uncertainty but a snapshot of the community uncertainty. We also note that the peak in our estimate of the uncertainty distribution is very consistent with the likely range from the IPCC. The result is similar to the worst case estimate obtained by cherry-picking the worst case published result for each contributor to sea level rise (ocean expansion, glacier melt, ice-sheet melt, ground water pumping), and adding them up. This cherry picked scenario does not have a probability attached to it. Nevertheless it is useful because it strengthens our assertion that other lines of evidence are needed to justify a larger sea level rise this century.
It may seem like an alarmist paper, but really it is the opposite because we are arguing that even faster rates of sea level rise are improbable. We note that sea level rise does not stop in 2100.
How is an upper limit useful?
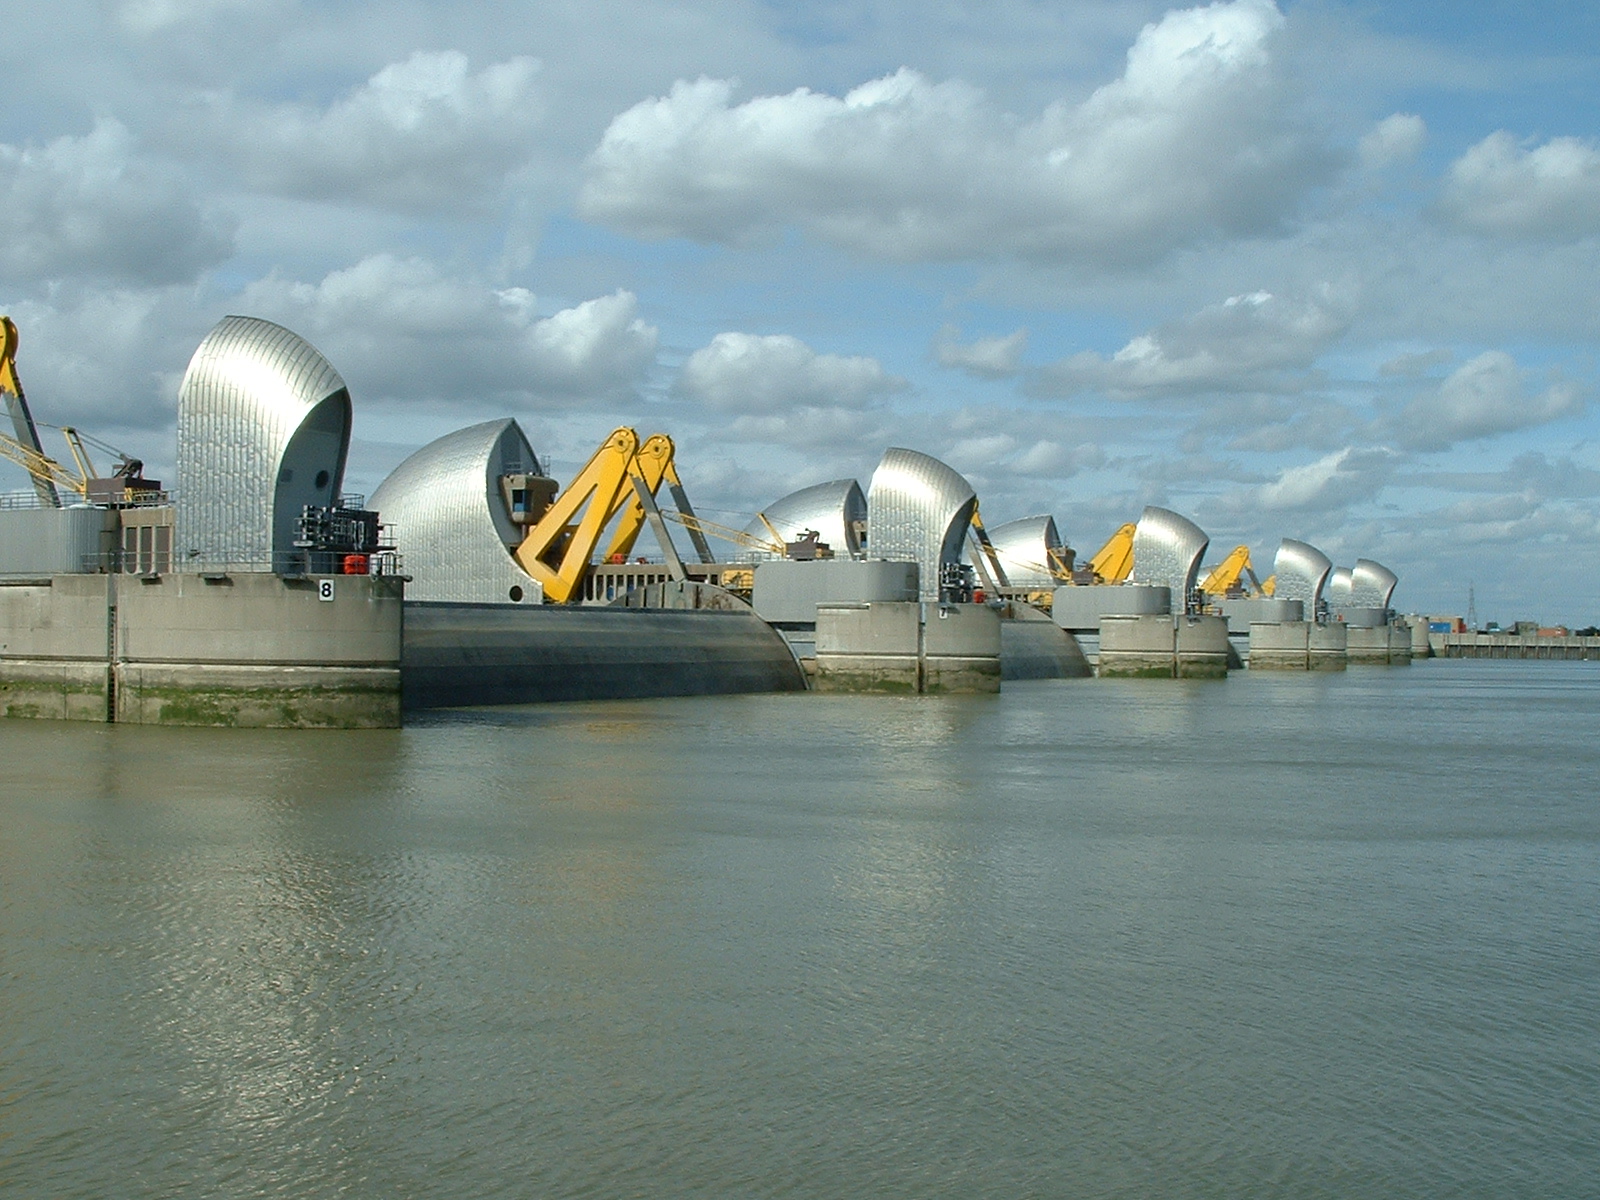
Shortly, it is primarily useful as a tool in adaptation planning. There may be certain critical infrastructure where it is wise to take the worst-case into account in the planning. Consider the Delta works, or the Thames Barrier. We note that large national climate reports have provided such high end scenarios. The UK has a high-plus-plus scenario in their UKCP09 report which is accompanied by these words: “we provide the scenario as some users may find it useful to aid contingency planning”. This is exactly how this unlikely scenario is useful. Our high end scenario of 1.8m (=6 feet) is very close to the highest scenario of 6.6ft adopted in the US NCA2014 report. Our result justify this 6.6ft choice for the highest scenario.
“While large changes in the ice sheets are unlikely, the thinking goes that there is too much at risk to plan for only an average amount of sea level change. These scenarios are not there to worry people, but to ensure our flood protection can cope with whatever the sea might throw at us.” Robert McSweeney / carbonbrief.
… but Antarctica is already collapsing.
Any value for the upper-limit would meet opposition. Some would see it as overly alarmist, and others would argue that things could go a lot worse. We believe that with the methods we use, we fairly represent the broader community uncertainty.
For the ice sheet contribution we used a shap-shot of the expert uncertainty from 2012 (Bamber & Aspinall, 2013). Since then several studies have found that parts of Antarctica is already collapsing. This new knowledge may alter expert opinion (as we note in the paper), but we can only speculate by how much. This has led Joe Romm at Think Progress to argue that our study therefore “vastly* underestimates” worst case sea level rise. However, domain experts are ahead of the game, and ice sheet experts have long considered the possibility of a collapse. It is important to realize that the expert elicitation we used did not only ask for a best estimate, but asked each scientist to give a confidence interval. And it is clear from their responses that they did consider this possibility.
“This indicates a growing view that a significant marine ice-sheet instability in the WAIS could initiate in the coming century.” -From Bamber & Aspinall 2013.
The new studies do not really inform on how fast that might happen, and I believe that the high-end would not change much if the same experts were asked the same question now. I speculate that these new studies will have a greater effect on what experts consider to be the most likely value, than the tail.
* Note the thinkprogress piece has since been amended to remove “vastly” from the headline.