Glacier projections
Graham Cogley (2012) regularized a number of projections of glacier wastage in a recent book (so that all numbers include the glaciers peripheral to the ice sheets, and cover the entire 21st century).
I have followed his example but added new projections, and also regularized for the different scenarios used. So in the figure shown i regularize for:
- Scenario differences.
- Confidence interval width
- Temporal coverage. I do this by interpolating into the Marzeion et al. 2012 curve. (very similar to plain scaling based on interval length).
- Spatial coverage. Not all projections include the glaciers peripheral to the ice sheets.
See details on the conversions below.
Please note that the majority of these papers assume an initial glacier mass which is greater than my recent estimate. However, Slangen and van de Wal find that 21stC projections are not very sensitive to initial volume. On the other hand, some of the high end ice loss projections are greater than my total volume estimate of 35 cm!
**See also **
This review of global glacier volume estimates.
**Some comments **
One difficult issue that handicaps all models is how you get from the GCM grid point precipitation to the precipitation at the glacier. Mountain range precipitation is notoriously hard to model, and resolution is a critical issue. I don’t think that applying a precipitation lapse rate will solve the issue. I would prefer that the glacier precipitation is inferred by assuming pre-industrial mass balance, and then scaling that precipitation with GCM precip anomalies.
A plea to modellers
Modellers please model the entire period covered by the PMIP+Historical+RCP45 experiments. This would greatly help in assessing the plausibility of the individual projections. This would allow us to compare the model response to the Leclercq et al. glacier length based volume estimates. I think it is a minimal requirement that the model captures the curvature at the end of the little ice age. If it doesn’t then you should reconsider how your model is being calibrated.

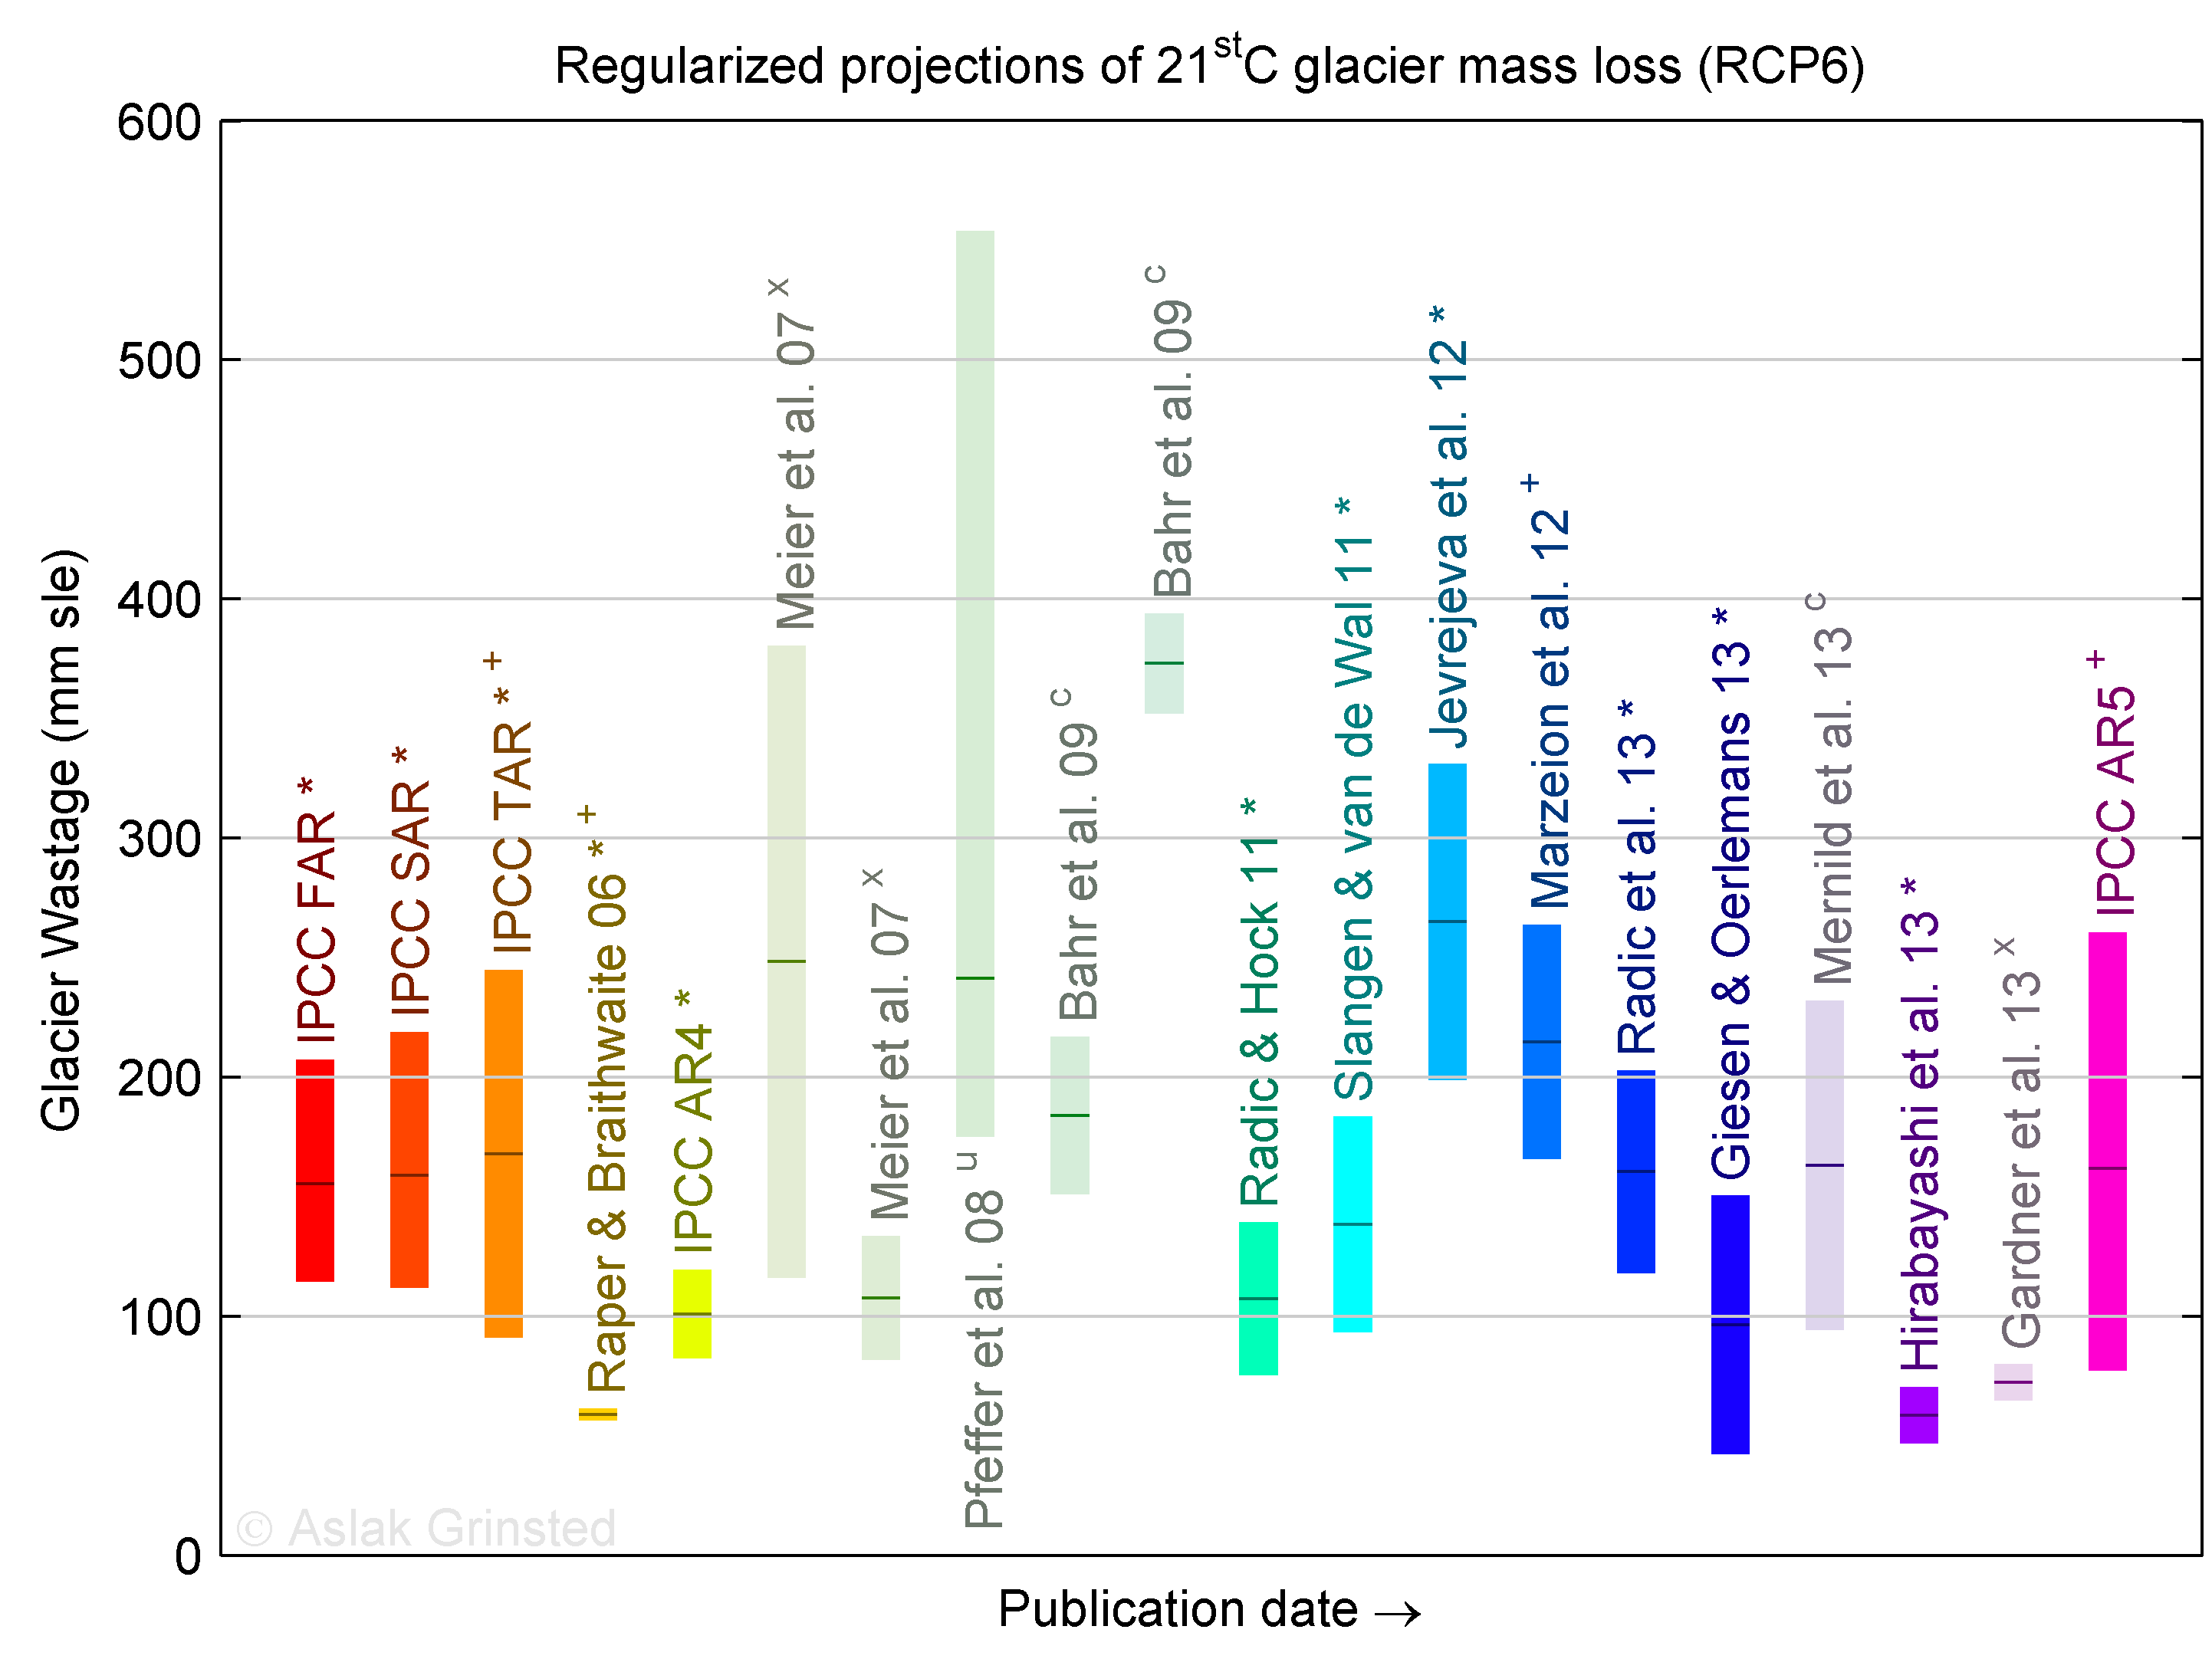
21st C Projections of glacier mass loss in sea level equivalent. Uncertainties are adjusted to 1 sigma (except for u)
- adjusted for scenario
+adjusted for spatial coverage
c committed loss rather than a 21stC projection.
u deliberate search for upper bound (not 1sigma, but 3 distinct estimates)
x statistical extrapolation
Lighter shading: Not an actual projection for the 21stC. Used for commitment, upper bound, and extrapolation estimates.
Note:
My personal assessment is that the AR5 is good both in terms of central estimate and uncertainties. (Unlike my view of the ice sheet projections.) That does not mean it could not conceivably be higher because all projections suffer from sparse data, poor precip handling, and how to deal with marine terminating glaciers.
- Only publications after Marzeion 2012 have used the full Randolph glacier inventory.
- Pfeffer is a deliberate search for an upper bound rather than a projection. (should perhaps be removed from plot)
- It is remarkable how consistent the IPCC reports have been with the exception of AR4.
- Raper & Braithwaite and Hirabayashi projections are the lowest and they both use grid based models.
- Scaling a ‘central estimate’ Marzeion model to match Gardner or Leclercq rates results in an almost perfect match with AR5 (not shown).
- Meier et al. 2007 extrapolated rates that were much greater than present best estimates from Gardner et al. 2013.
- The Jevrejeva model is not designed specifically for glacier projections and the projection is more a test of how this would bias SEM results.
- It is hard for me to imagine anything higher than the Bahr et al. 2009 high estimate and anything less than the Gardner et al 2013 extrapolation.
Scenario conversion factors applied:
These are the multipliers used to convert original projections into RCP6:
- RCP6/RCP45: 1 (based on AR5 table 13.5.)
- RCP6/RCP85: 0.77 (based on AR5 table 13.5.)
- RCP6/A1B: 0.86 (based on AR5 table 13.5.)
- A1B/IS92A=1.20; (calculated by forcing a Jevrejeva model with TAR table II.3.11)
- IS92A/SA90=0.87; (calculated by forcing a Jevrejeva model with SAR fig Ax.9.)
Marzeion et al. 2012 result in slightly different conversion factors.
Spatial coverage corrections:
Radic et al. 2013 and Giesen and Oerlemans 2013 are the only projections that use Randolph Glacier Inventory and include both the Greenland and the Antarctic periphery. So I base it on the average of these two papers. I get the 21stC projections for these regions to be
- Antarctic glacier loss = 18.5% of global
- Greenland glacier loss = 10.6% of global
References:
- Cogley, J.G. (2012), The future of the world’s glaciers. In: The Future of the World’s Climate. A. Henderson-Sellers and K. McGuffie (eds) Elsevier doi:10.1016/B978-0-12-386917-3.00008-7
- IPCC reports here.
- Raper & Braithwaite 06 (range from 2 GCMs only. Expected value of difference is 1.14 sigma)’
- Meier et al. 07 (range from table1)
- Pfeffer et al. 08
- Bahr et al. 09
- Radic & Hock 11 (range from giesen and oerlemans 13 table 4)
- Slangen & van de Wal 11 (range from giesen and oerlemans 13 table 4
- Jevrejeva et al. 12 (central estimate from J12, range from scaling with leclercq11 uncertainties. Note: not meant as a projection but a test of the SEM.)
- Marzeion et al. 12
- Radic et al. 13
- Giesen & Oerlemans 13 (range from giesen and oerlemans 13 table 4)
- Mernild et al. 13
- Hirabayashi et al. 13
- Gardner et al. 13 (A constant rate extrap)
_I intend to keep this page will be updated. You can tweet, mail, or comment if you have more studies i should add. _
Note: the painting in the featured image for this post, is by Jill Pelto. It shows historical data for glacier mass loss in the North Cascades. Follow the link and check out her other work.