Detection and attribution of past changes in cyclone activity is hampered by biased cyclone records due to changes in observational capabilities. Here we relate a new homogeneous record of Atlantic tropical cyclone activity based on storm surge statistics from tide gauges to changes in global temperature patterns. We examine 10 competing hypotheses using non-stationary generalized extreme value analysis with different predictors
(North Atlantic Oscillation, Southern Oscillation, Pacific Decadal Oscillation, Sahel rainfall, Quasi-Biennial Oscillation, Radiative Forcing, Main Development Region temperatures and its anomaly, global temperatures, and gridded temperatures). We find that gridded temperatures, Main Development Region, and global average temperature explain the observations best. The most extreme events are especially sensitive to temperature changes, and we estimate a doubling of Katrina magnitude events associated with the warming over the 20th century. The increased risk depends on the spatial distribution of the temperature rise with highest sensitivity from tropical Atlantic, Central America and the Indian Ocean. Statistically downscaling 21st century warming patterns from 6 climate models results in a 2-7 fold increase in the frequency of Katrina magnitude events for a 1°C rise in global temperature (using BNU-ESM; BCC-CSM-1-1; CanESM2; HadGEM2-ES; INM-CM4; NorESM1-M).
**Citation: **
Aslak Grinsted, John C. Moore, and Svetlana Jevrejeva (2013), Projected Atlantic hurricane surge threat from rising temperatures, PNAS, doi:10.1073/pnas.1209980110
[pdf]
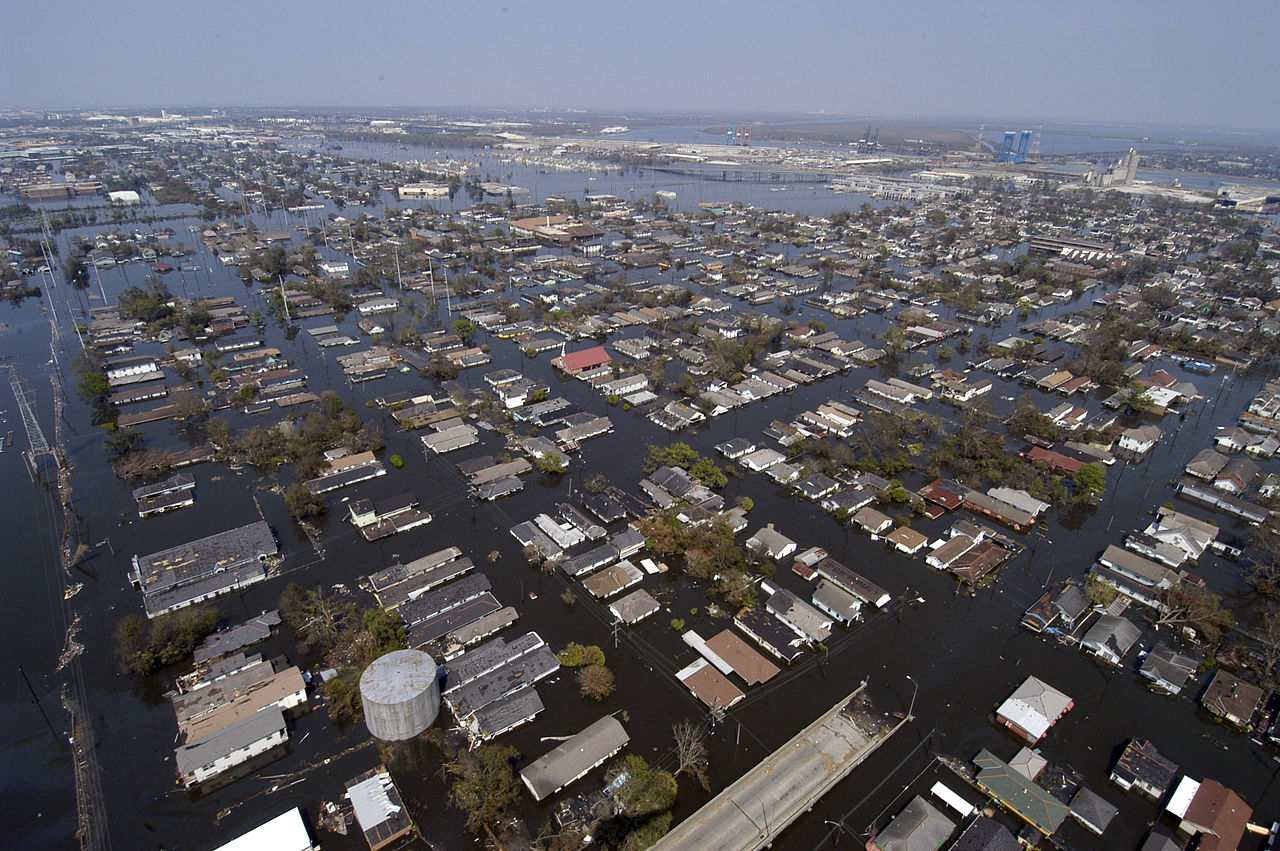
Figure caption: The frequency of Katrina magnitude surges increase greatly in a globally warming climate.
Comment & reply.
Kennedy et al wrote a comment to this paper questioning whether the Katrina benchmark as defined in the paper is appropriate given that our closest tide gauge at Pensacola was 162 km from highest high water mark left. However the highest high water mark records are set by very short lived events and we initially apply a 24 hour average to all records. This low pass filter removes these highly localized extremes and the Pensacola record becomes much more representative of the larger scale disturbances in sea level. It is therefore an apples to orange comparison to compare high water marks to our surge record. We demonstrate this to be the case in our reply to Kennedy et al. here. See also this page for further details on our processing choices.
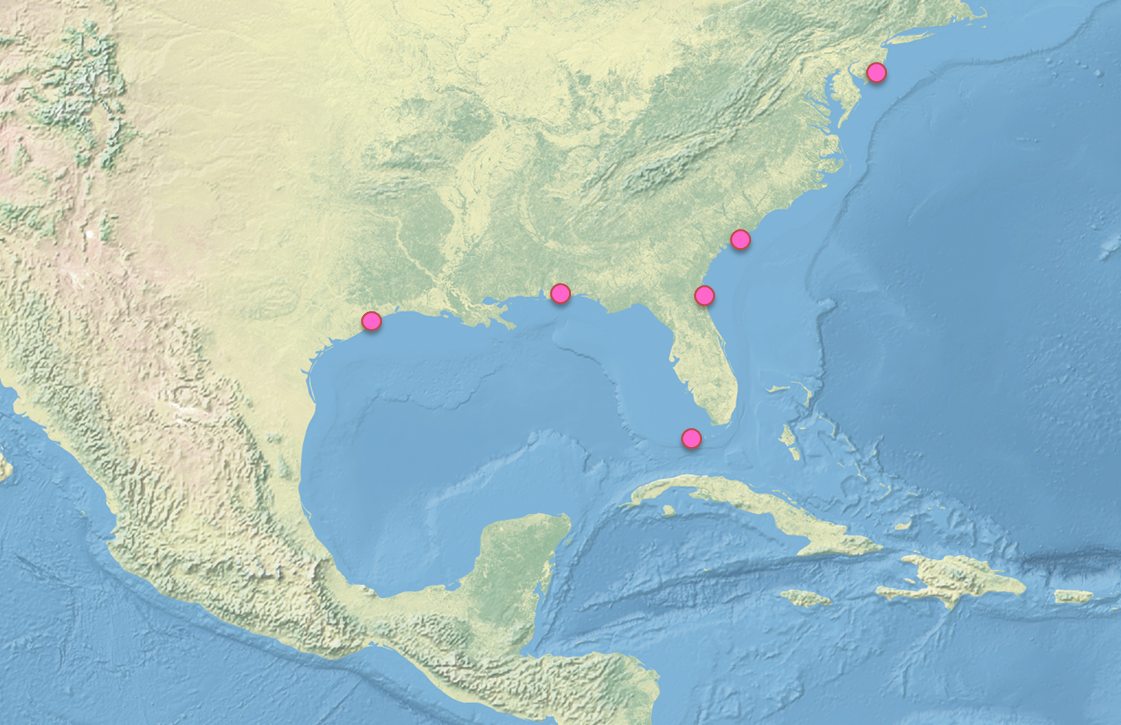
The surge index record used in this paper is based on six long high resolution tide gauge records (see map) from the US Atlantic and Gulf coasts.
Table 2 shows how well different predictors are able to explain past surge variability. Temperatures and even just a plain linear trend is better than many other commonly proposed predictors. The sensitivity is given per degC or per century.
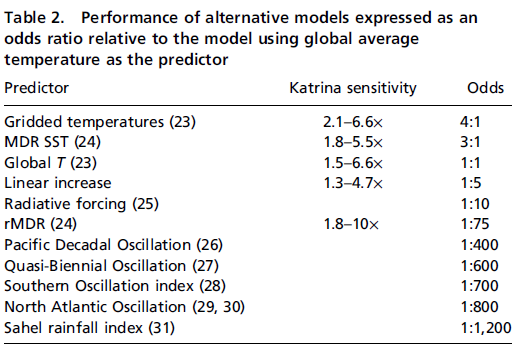
Temperatures best predict hurricane surges.
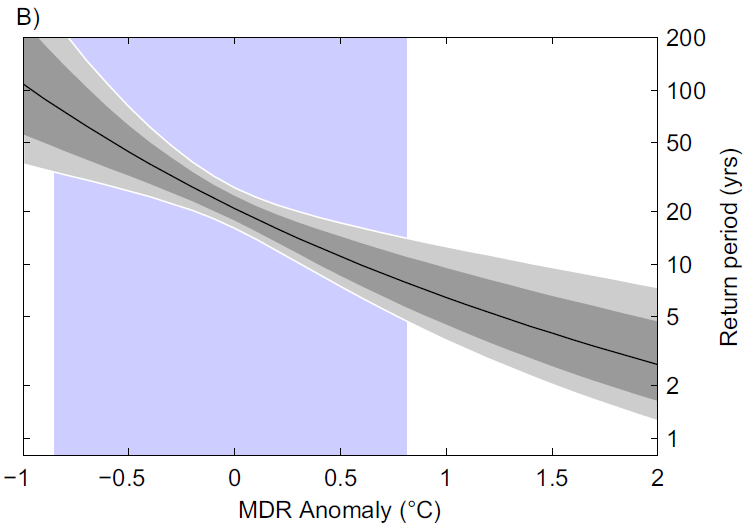
This figure shows how warming of the main development region temperatures is associated with much more frequent Katrina magnitude surges.