Return period of Boulder 2013 extreme rain
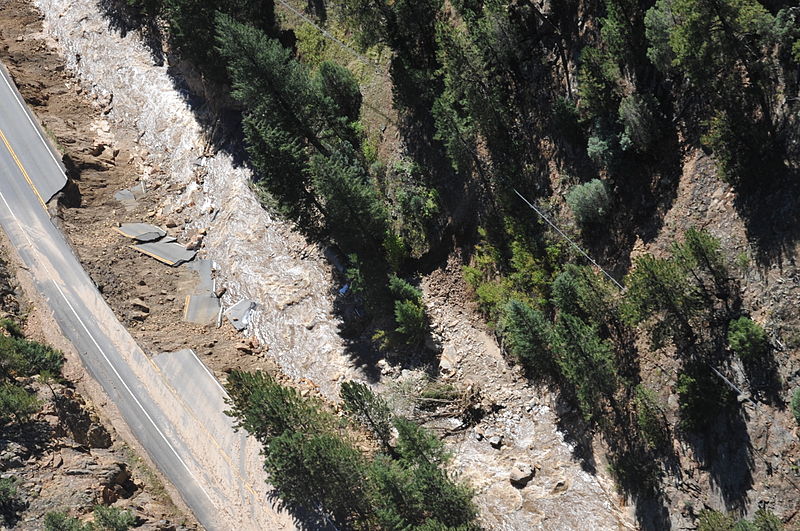
! Several media stories on the Colorado floods talk of it as a 1000-year flood. However, the original source of this claim was talking about a 1000-year precip event (not the same as a flood-event). Pielke Jr discusses this on his blog.
The source for the 1000-year return level estimates appears to be this NOAA page. We can argue about how solid these very rare return levels are as they obviously must be based on an extrapolation beyond the largest recorded event. Nevertheless out of curiosity I looked up what return period NOAA estimated for the observed rainfalls.
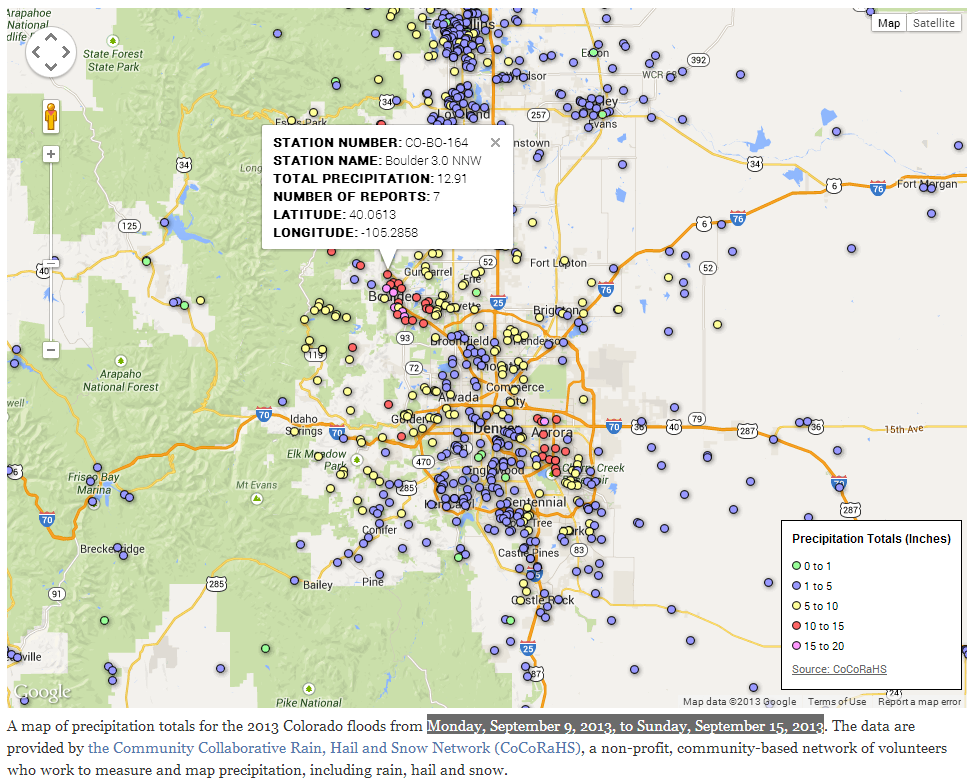
I found this map of weekly rain totals and clicked on a gauge in Boulder. It received 12.91 inches over 1 week. Other neighboring gauges experienced similar amounts.
I then went to the NOAA return-period/return level page and plugged in the lat lon of the station and got this return level plot for 7-day totals:
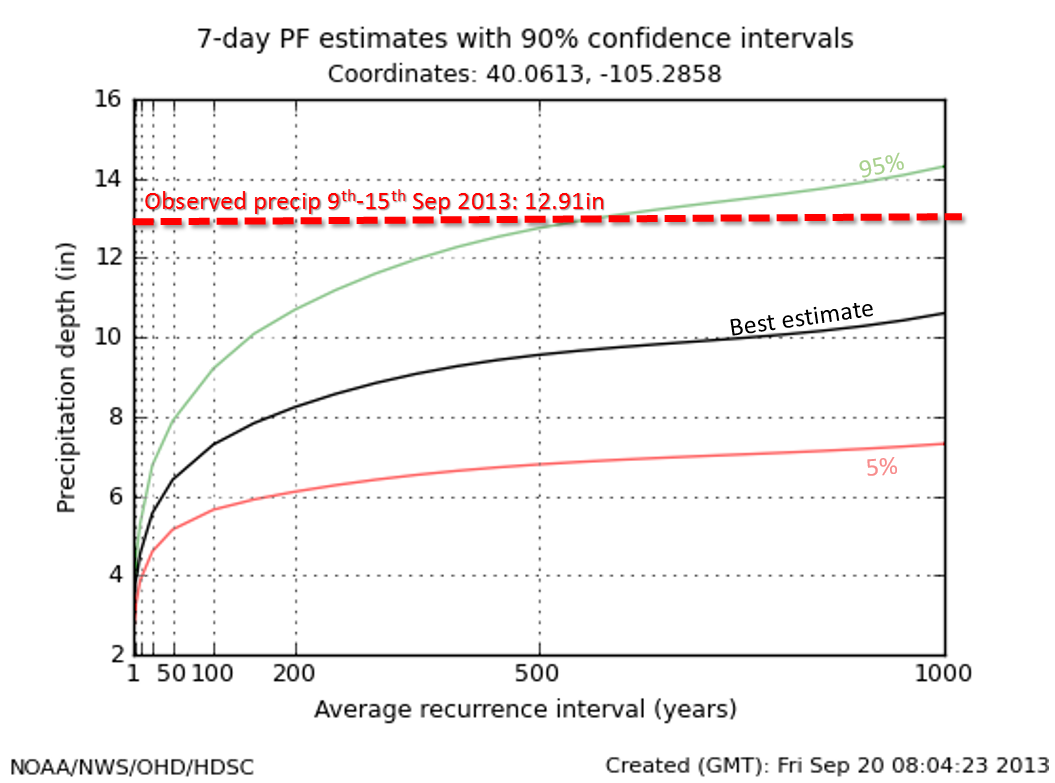
From that return level graph the rainfall appears to be inconsistent with anything less than a 500-year event and the best estimate is that it is more rare than a 1000 year event. But again estimating the return period for this precipitation event is extrapolating far beyond past records and we should take it with a grain of salt. I would not go as far as calling it pure fantasy however.
Once the return period estimates are updated with the new observed precipitation extreme then the odds must shorten. Now that we have seen that it can happen then it will no longer seem quite as unlikely that it might happen again.
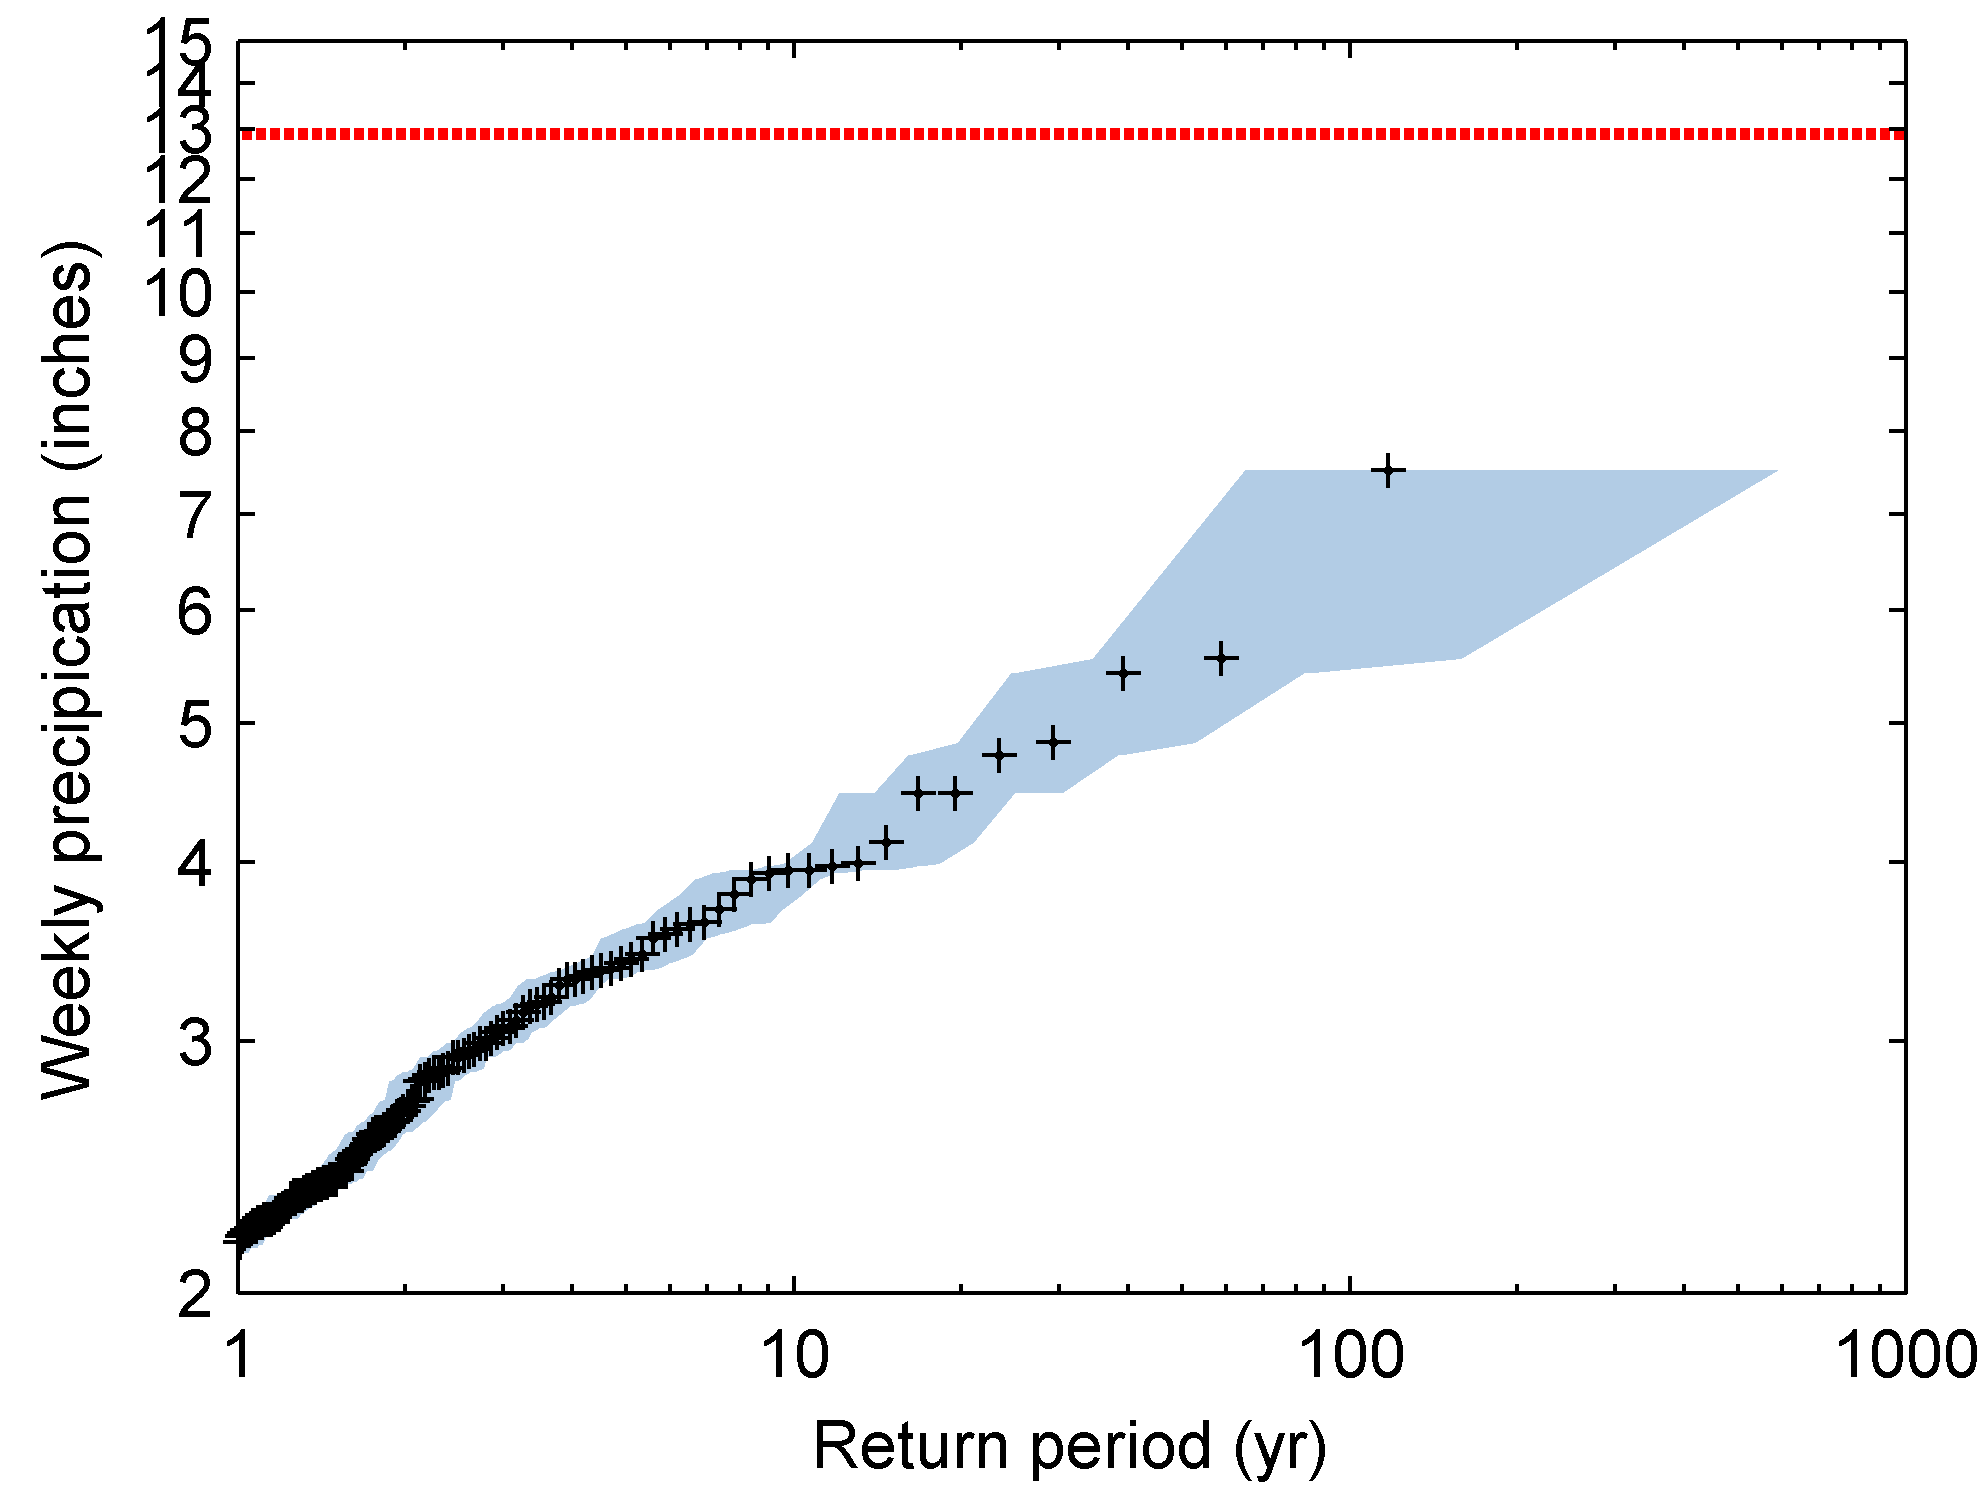
I have also downloaded Boulder precip data from here and calculated my own empirical return period plot (see below). From this we clearly see that 12.91in is really off the scale. Prior to observing this extreme event you would probably have estimated a 1000 year return period (as indeed NOAA appears to have done). (shading is 1sigma).
Discharge in Boulder creek
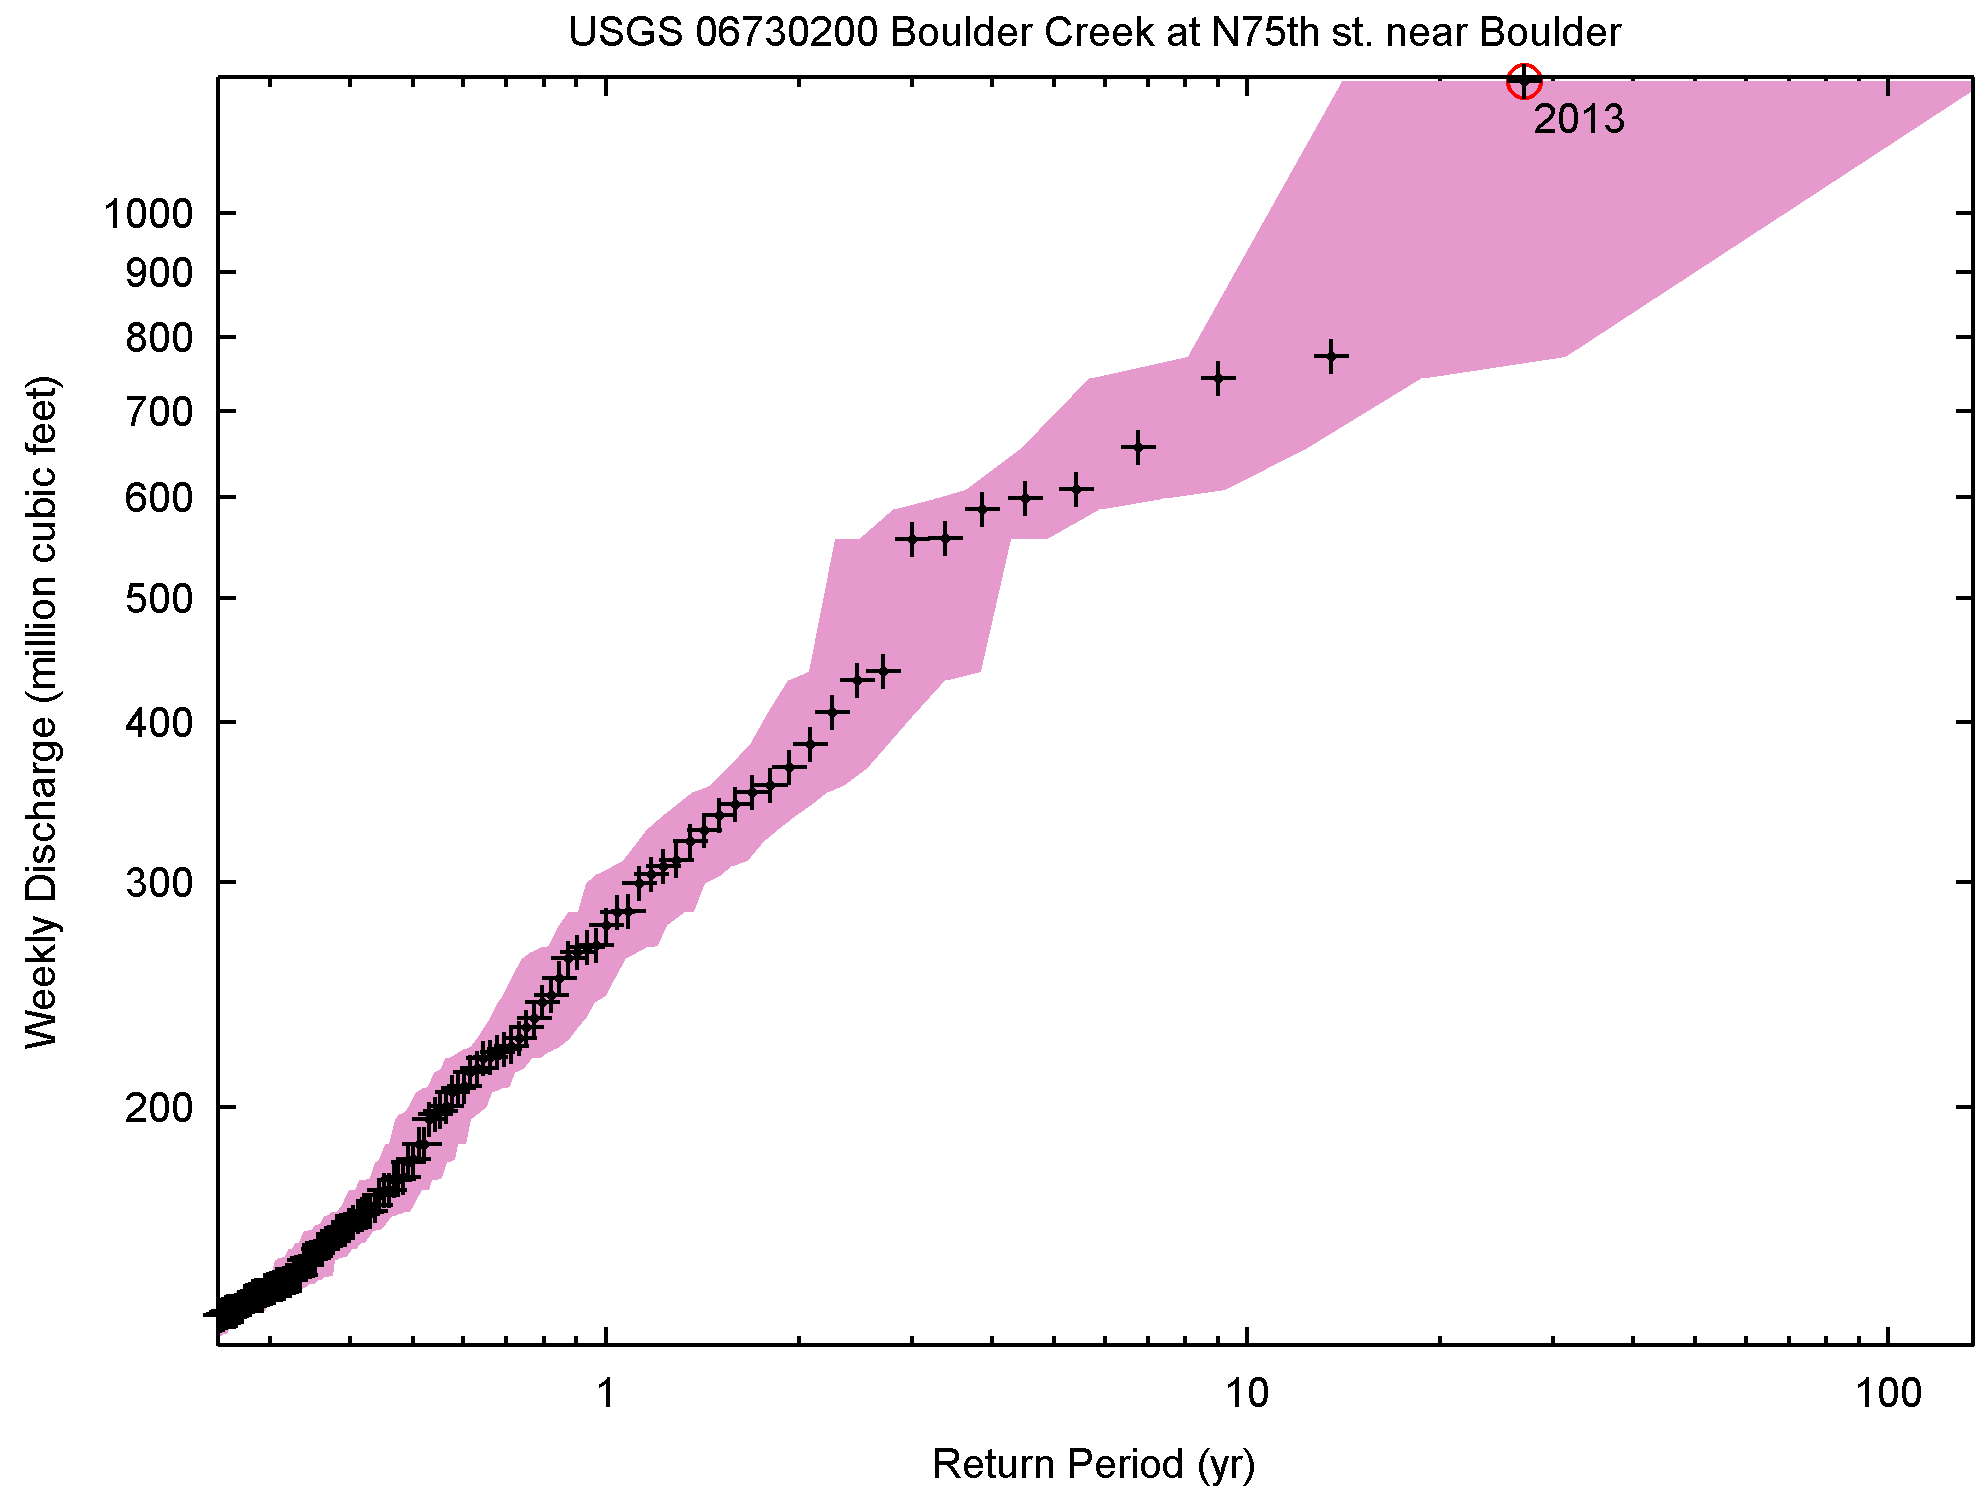
It would also be interesting to see how the weekly discharge in Boulder Creek compares to the past. At this station I get the weekly discharge (starting the 11th sept 2013) to be: 1.42bn feet3 = 40M m3. A historical record can be found here (since 1986). Taking this record, and stacking into weekly bins and looking at empirical return periods then I get the plot on the right. (shading is 1sigma / 17-83%). There the 2013 event comes out to be a ~25-year event (unsurprisingly since it has been observed once in a record starting in 1986). But you can also notice that the 2013 event does not diverge from a straight line extrapolation of the more common events. I.e. you would/should probably have expected a ~25 year return period prior to the 2013 floods.
Detail:
Why do i look weekly discharge rather than flood levels? The reason is that flood levels and instantaneous discharge are very sensitive to changes in infrastructure and adaptation/protective measures (e.g. flood plains). Weekly discharge is much less sensitive to such changes. Return period confidence intervals have been calculated using the approach described in the supplementary info to this paper.