Ice streams and ice sheet sensitivity
Ice streams can display oscillatory and even chaotic behaviour. How does the state of ice streams influence the predictability of the ice sheet response to anthropogenic forcing?
Nov 17, 2024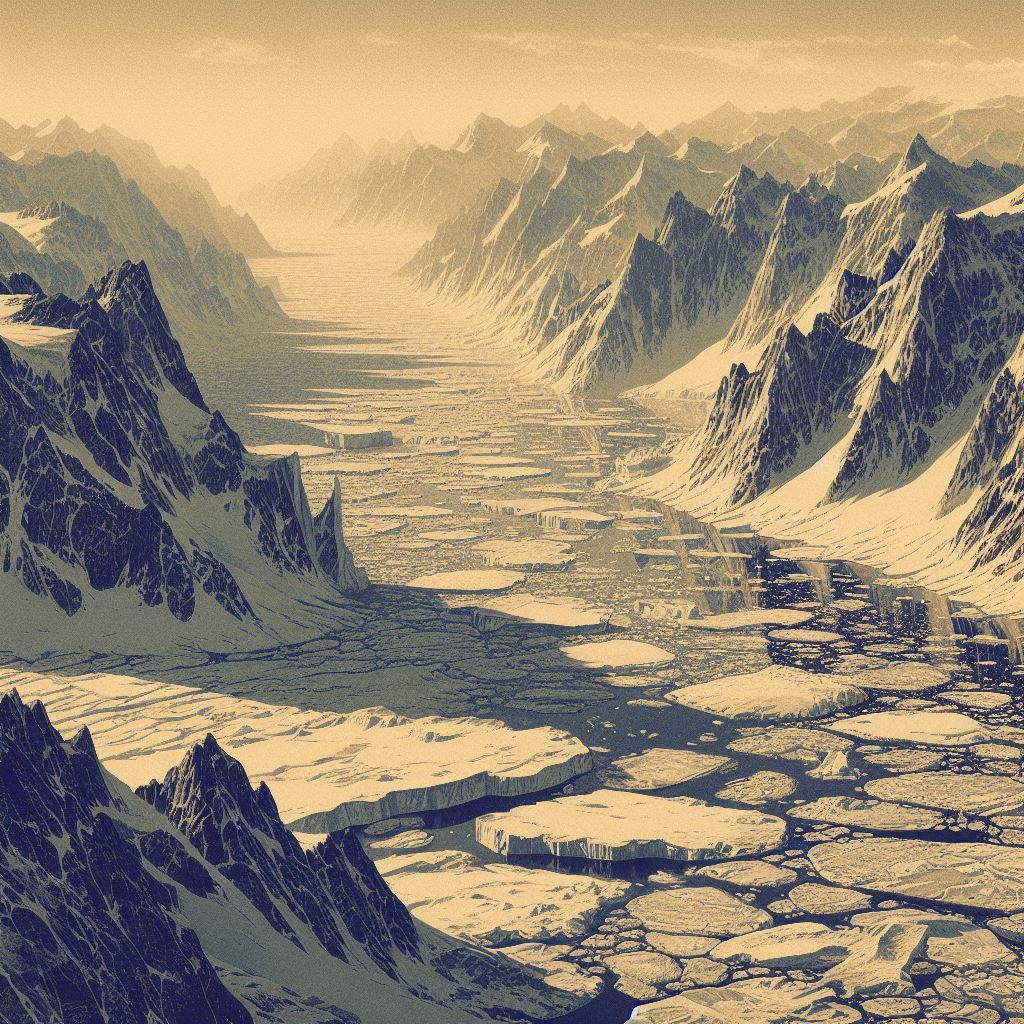
Ice streams can display oscillatory and even chaotic behaviour. How does the state of ice streams influence the predictability of the ice sheet response to anthropogenic forcing?
Nov 17, 2024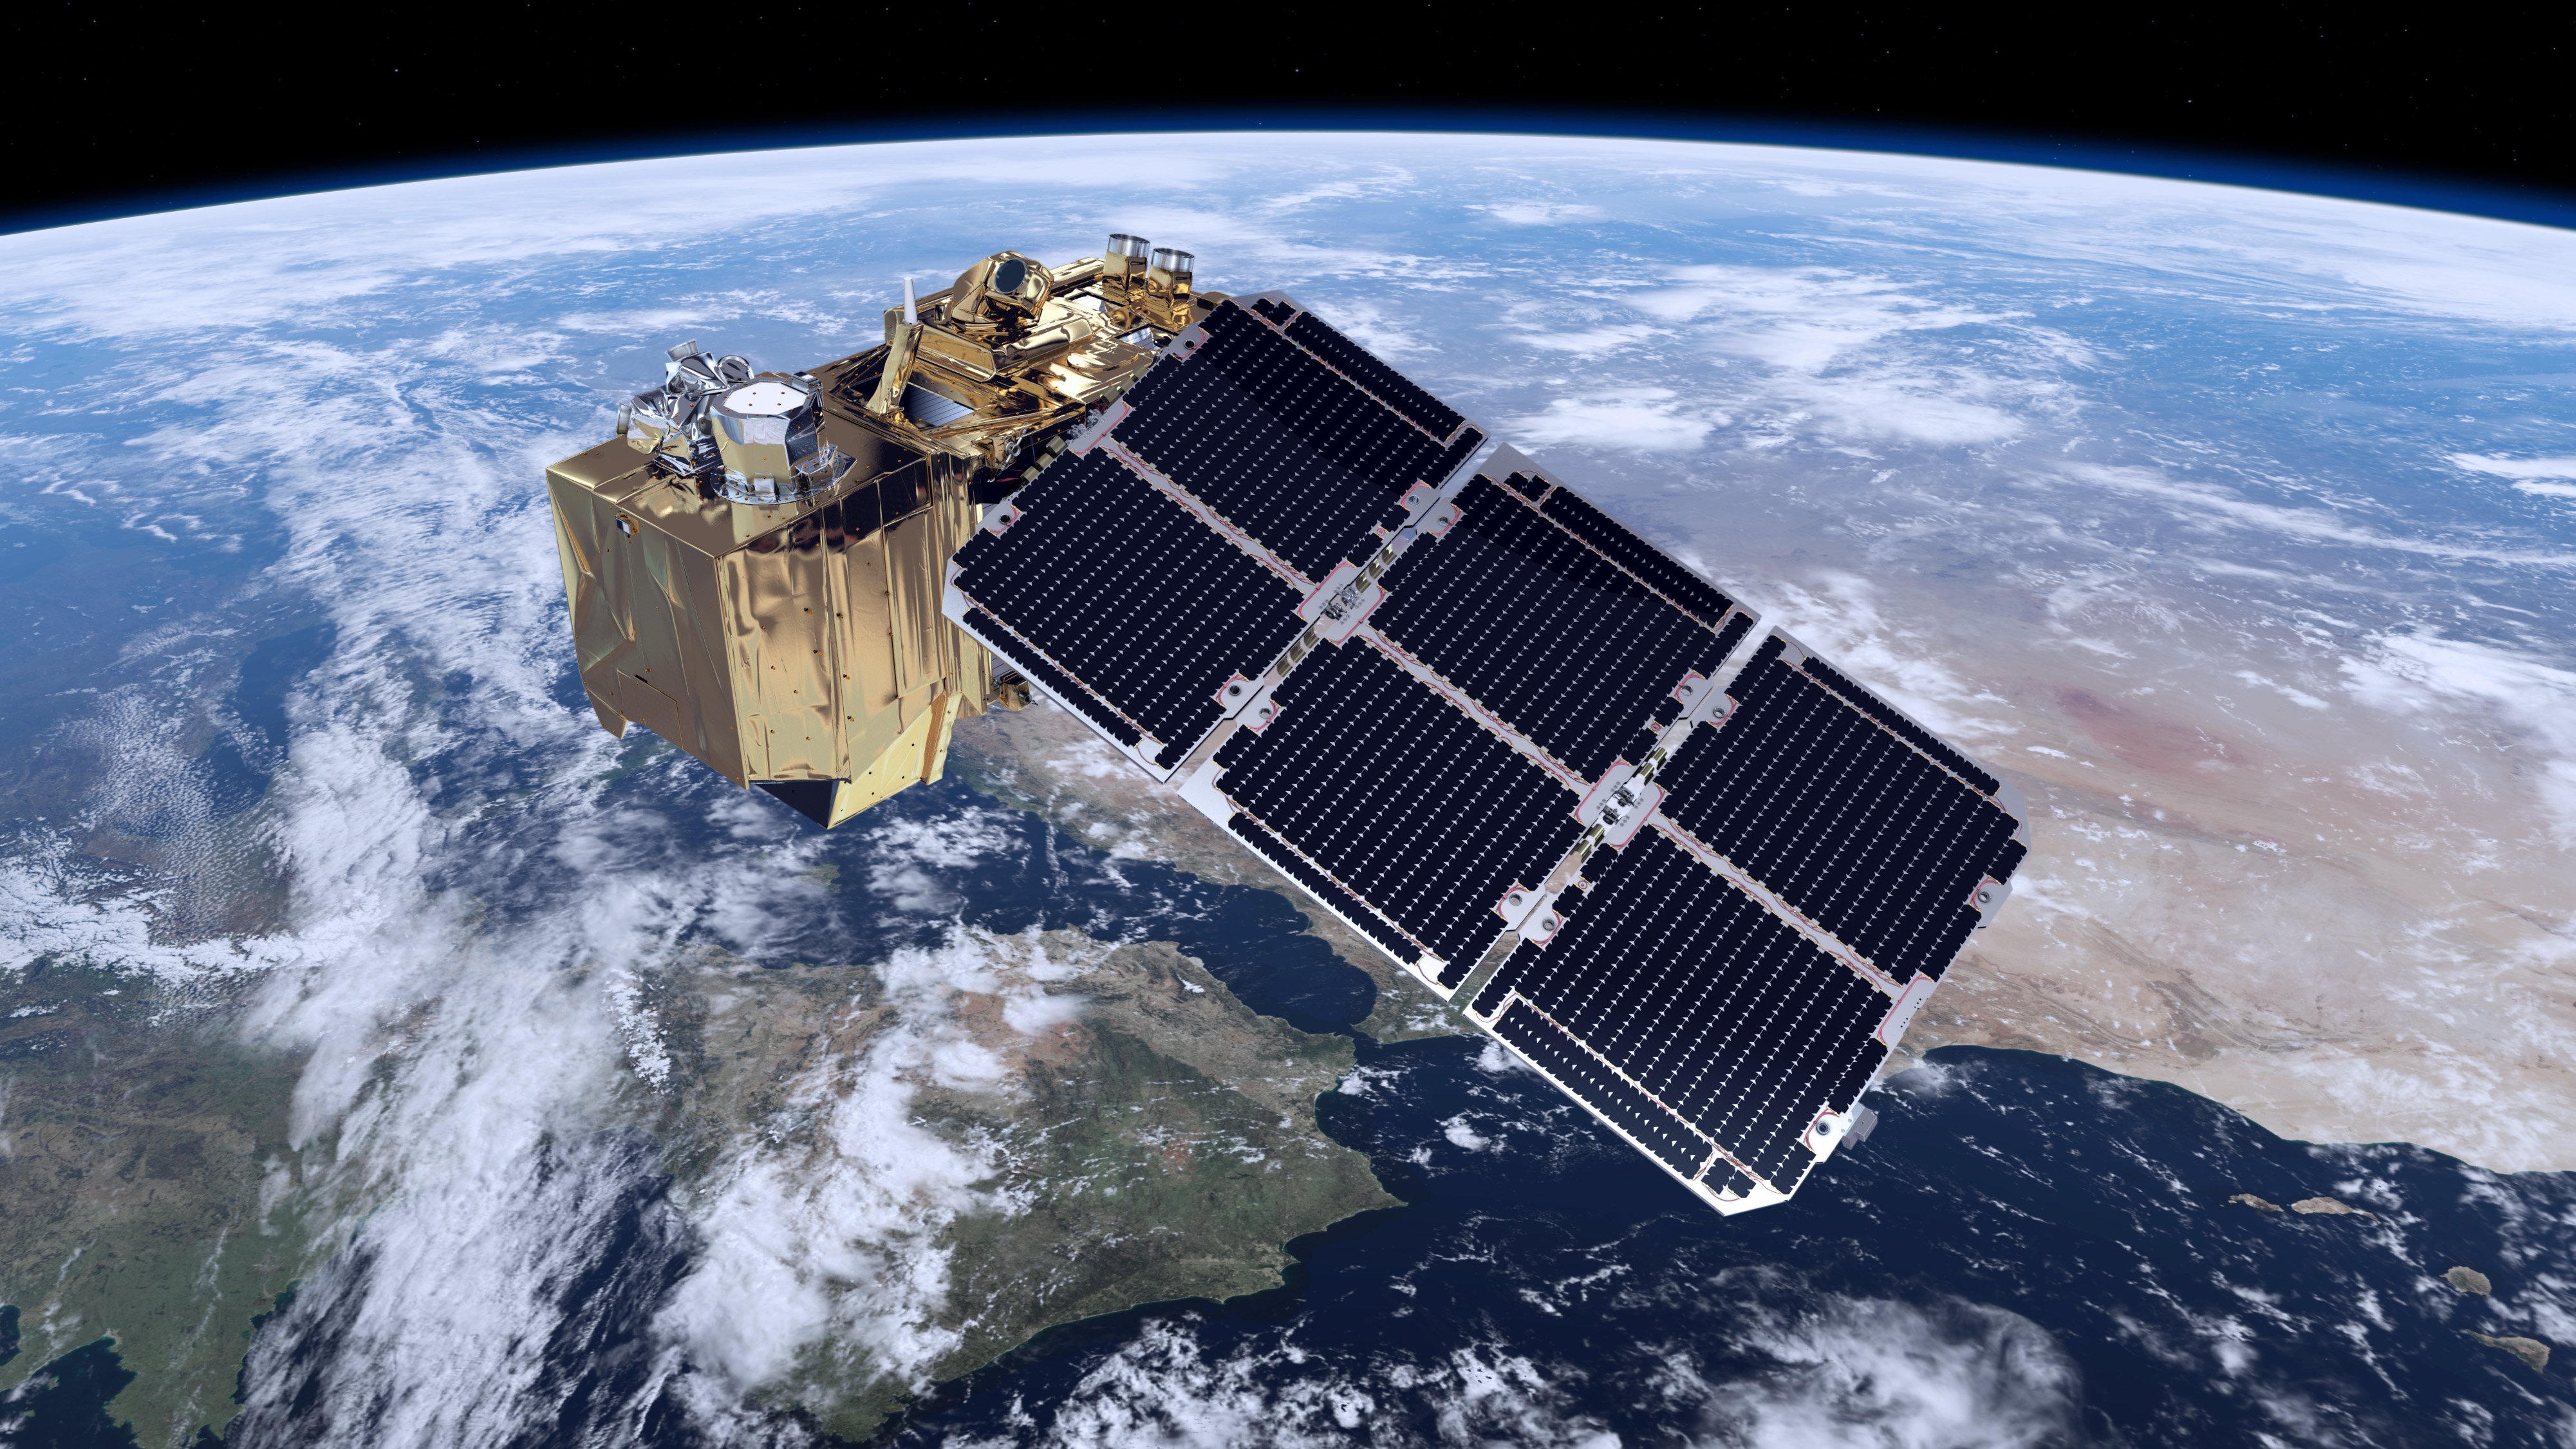
The ice sheets are vast and direct observations of many processes are sparse. How can we apply ML techniques to remote sensing data to fill gaps.
Nov 17, 2024
Sea level rise will become a huge challenge for coastal societies around the world. We need good data, we need good models, and we need to understand all changes.
Nov 17, 2024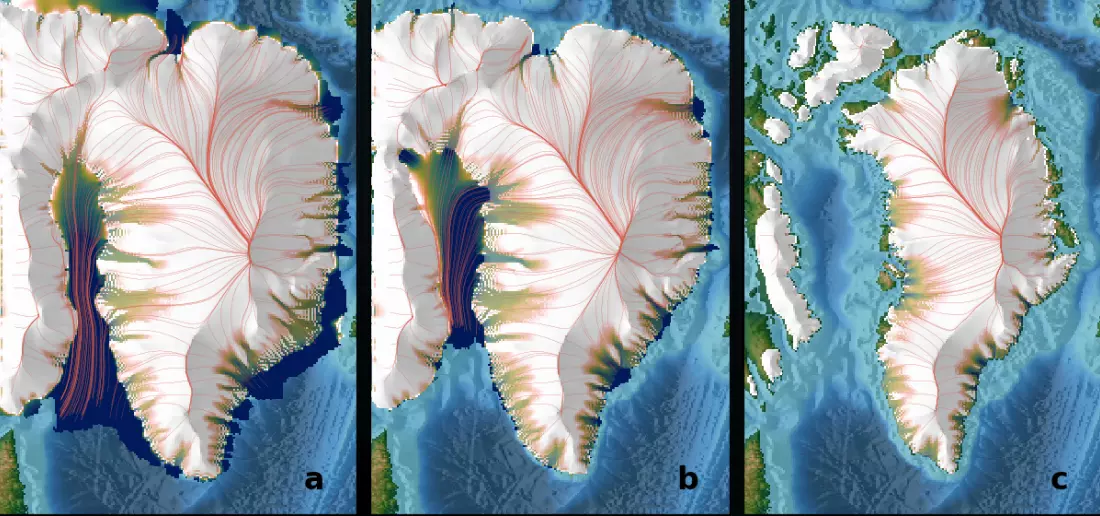
Abstract During the Holocene, the Greenland Ice Sheet (GrIS) experienced substantial thinning, with some regions losing up to 600 meters of ice. Ice sheet reconstructions, paleoclimatic records, and …
Jul 16, 2024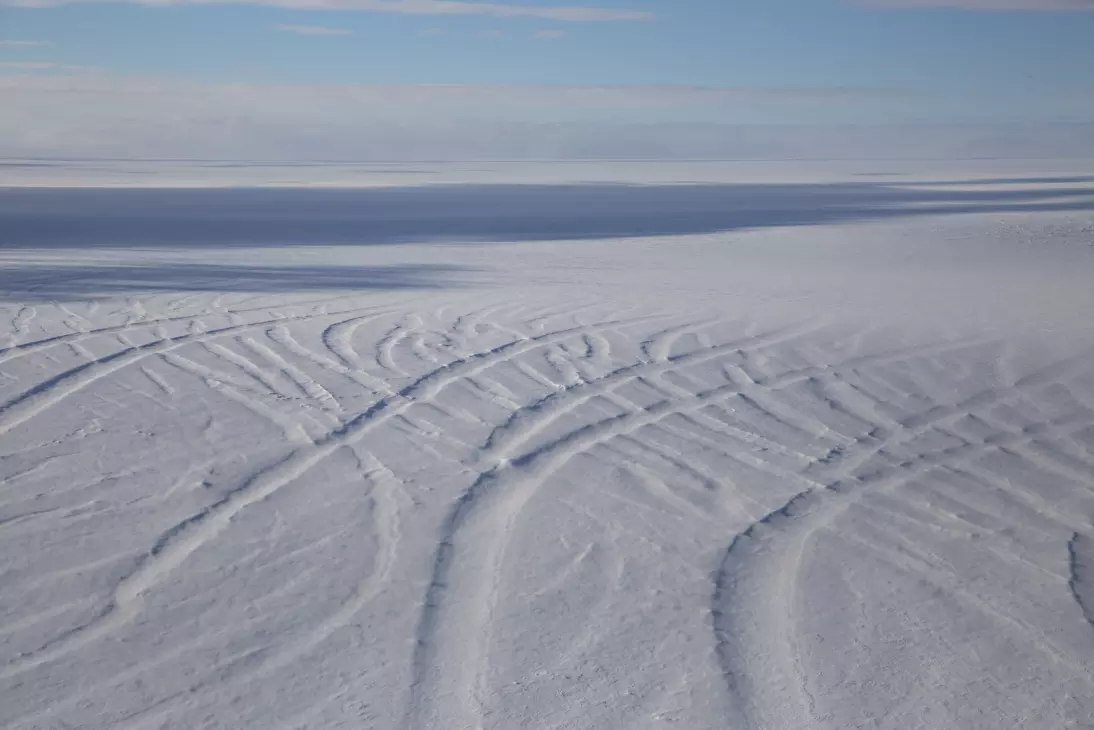
We uncover a new failure criterion for ice using a large dataset of greenland crevasses. Abstract Ice fractures when subject to stress that exceeds the material failure strength. Previous studies have …
Apr 26, 2024
Here are some personal notes for how to make elevation models using Blender. install the BlenderGIS plugin. (optional) import geotiff with import using geotiff “DEM as a displacement …
Feb 1, 2024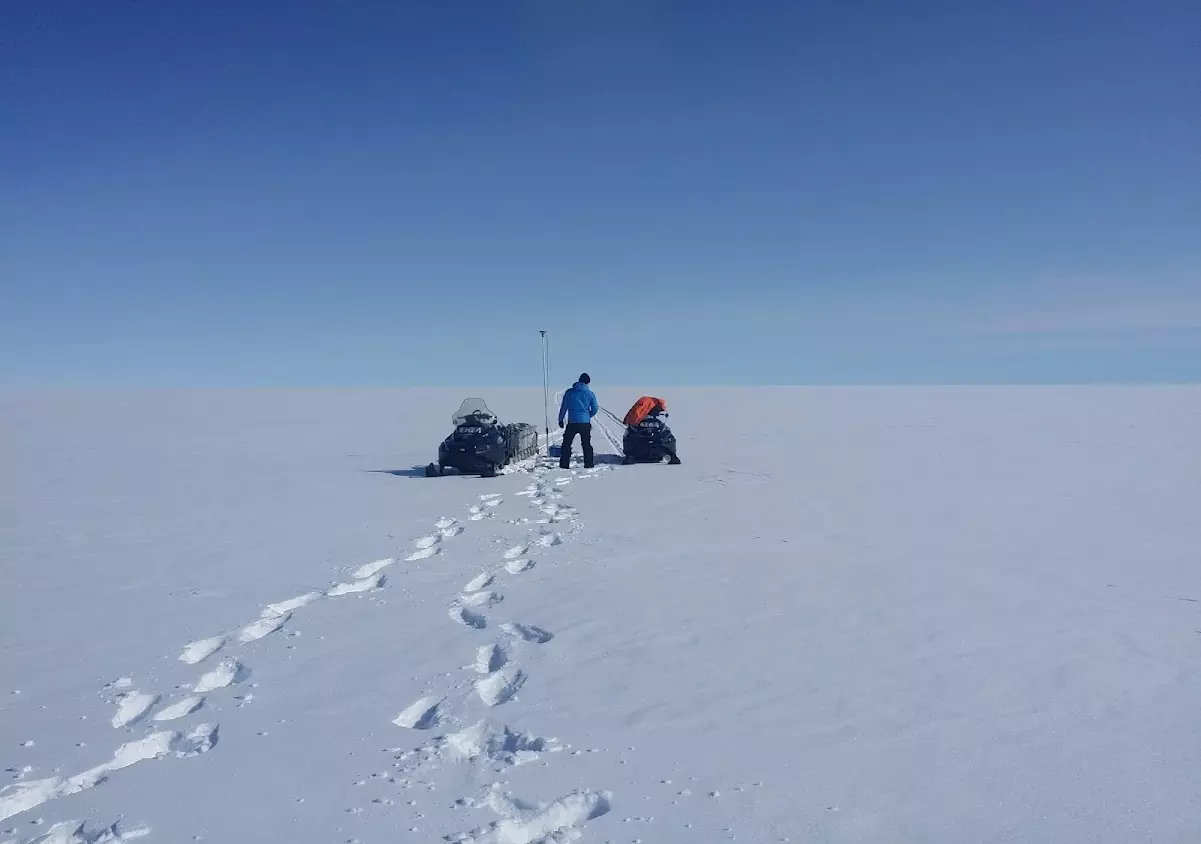
Temperature variability in the forcing of the ice-sheet model affects both the Greenland Ice Sheet equilibrium volume and its transient response to instantaneous changes in temperature. Abstract The …
Aug 9, 2023
Simulating higher-order fabric structure in a coupled, anisotropic iceflow model: application to Dome C. Abstract Ice-crystal fabric can induce mechanical anisotropy that significantly affects flow, …
Jul 31, 2023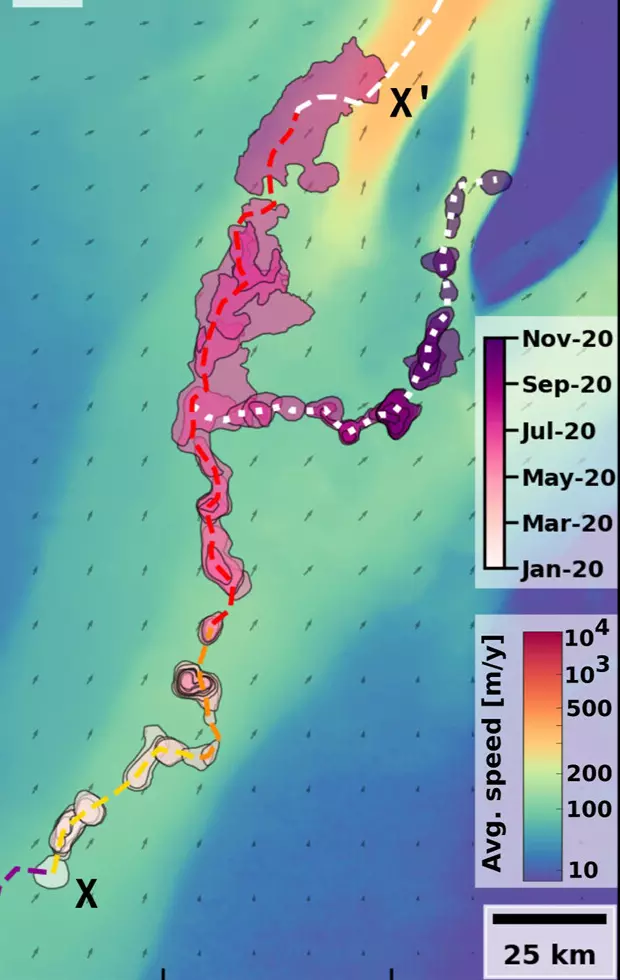
The presence of water flowing beneath the Greenland Ice Sheet impacts the friction exerted on ice flowing from inland to marginal regions, potentially affecting the rate of sea level rise by …
Jun 15, 2023
Crystal orientation fabric anisotropy causes directional hardening of the Northeast Greenland Ice Stream. Abstract The dynamic mass loss of ice sheets constitutes one of the biggest uncertainties in …
May 8, 2023
The planet is warming, and sea levels are rising as oceans expand and ice on land melts. The warmer the Earth gets, the faster the seas will rise. Projecting future sea level rise (SLR) using …
Oct 1, 2022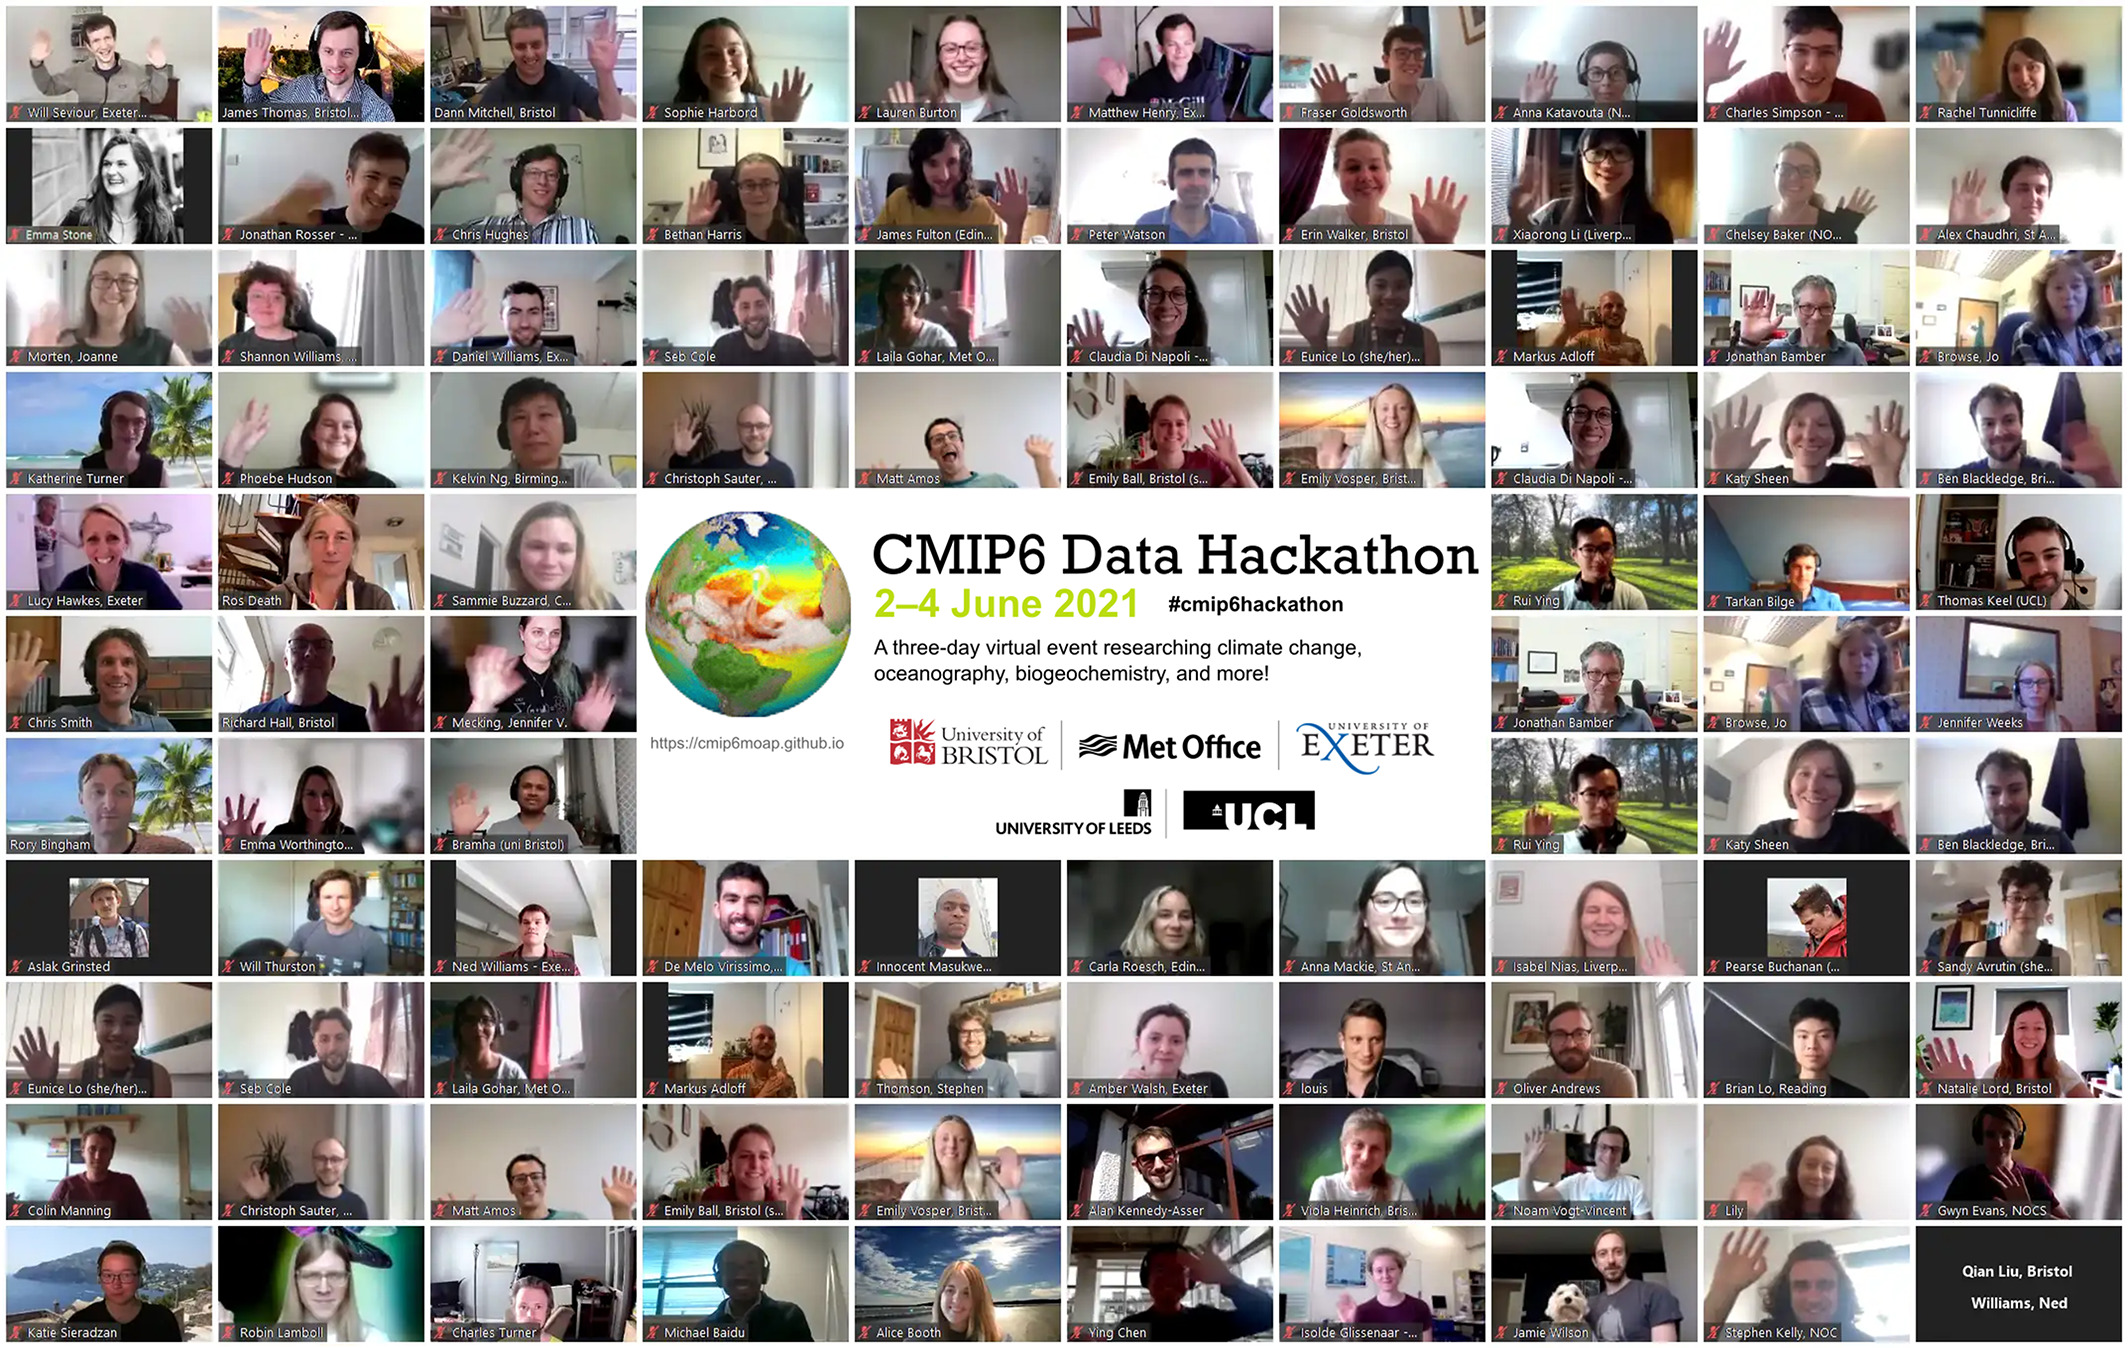
The Bristol CMIP6 Data Hackathon formed part of the Met Office Climate Data Challenge Hackathon series during 2021, bringing together around 100 UK early career researchers from a wide range of …
Jun 1, 2022