
Three views on sea level commitment
Three recent papers on long term sea level commitment:
- Models
* Levermann, Clark, Marzeion, Milne, Pollard, Radic, Robinson (2013). The multimillennial sea-level commitment of global warming. Proceedings of the National Academy of Sciences, doi:10.1073/pnas.1219414110 [link]
- Paleo-data
- Foster, G. L., & Rohling, E. J. (2013). Relationship between sea level and climate forcing by CO2 on geological timescales. Proceedings of the National Academy of Sciences, 110(4), 1209-1214. [link]
- Model inversion of paleo data:
- Wal, R. S. W., Boer, B. D., Lourens, L. J., Köhler, P., & Bintanja, R. (2011). Reconstruction of a continuous high-resolution CO 2 record over the past 20 million years. Climate of the Past, 7(4), 1459-1469. [Link]
- Paleo-data
Lets look at how big a sea level rise commitment these three papers have for a four degree global avg. warming. Only Levermann et al. gives the results in terms of global avg warming. Foster & Rohling gives the sea level commitment for CO2 levels which means we should convert using an estimate of the earth system sensitivity. Here i use 4.4°C/2xCO2 from Lunt et al. 2009 which means an eventual warming of 4°C corresponds to 525 ppm. van de Wal et al. plots the long term ice sheet loss as a function of NH-temperature, and he argues for a polar amplification factor of 2.7. Tglobal=4°C would correspond to TNH=11°C. When I use this approach then I get the following (just visually reading off the graphs using conversion factors as described above):
| Levermann et al. |
| Foster & Rohling |
| Wal et al. |
| FR alternative* |
*****The “FR alternative” is my reading of the Foster & Rohling graph. at around 600 - 900 ppm there seem to be two states. I interpret them to be associated with a threshold behavior of the East Antarctic Ice sheet. I do not think the averaging in the FR smooth is valid in this case. Similarly I see the 525 ppm as consistent with the Foster & Rohling orange line corresponding to total decay of West Antarctic and Greenland Ice sheets. This interpretation renders the Foster & Rohling results consistent with Levermann et al.. I also think that the results are consistent with van de Wal et al. - Assuming that the solid black line in Wal et al. is an average with similar caveats as the smooth in Foster & Rohling. (I am also concerned with the Levermann et al. straight line 1.2m/degC for Antarctica.)
Note that the origin (0,0) is not close to the FR smooth or the van de Wal et al solid black lines. This means you have to be quite careful with interpreting the results for 2°C which is closest to zero. However, I think that 2°C means a near total decay of the GrIS and an uncertain response of the WAIS. There is alot of evidence pointing to a WAIS collapse during the last interglacial (e.g. this).
**My personal conclusion **
- At 2°C (383 ppm) we will lose the Greenland ice sheet (according to models such as those summarized in Levermann - see Robinsson et al.). We do not really know how strongly the West Antarctic will respond. There is evidence of a large response during the last interglacial though (e.g. this).
- At 4°C (525 ppm) then we are pretty much committed to an eventual complete deglaciation of both the West Antarctic ice sheet and the Greenland ice sheet.
- At 6°C (720 ppm) we may be committed to an ice free planet.
Note these global warming temperatures are including the slow feedbacks (see earth system sensitivity /ESS). From this it looks as the Greenland ice sheet is pretty much doomed. WAIS may be doomed as well. But we might be able to avoid an eventual EAIS collapse.
Another recent study by Cook et al. shows evidence of a significant EAIS retreat in the Pliocene (2-3°C warming). More of such paleo records from around or through the ice sheets could be very helpful in interpreting the paleo sea level record.
In the bottom part of several Greenland ice cores we see some ice from the last interglacial. It is generally disturbed but it is there. This indicates that some ice sheet survived during the LIG, and perhaps the threshold behavior is more gradual than most models suggest. One mechanism could be a reduction of the desert effect when the ice sheet shrinks (moisture can travel further inland and provide more snow at high elevations). See e.g. Langen & Solgaard and Helsen et al. 2013.
**Time scales. **
I think it is important to stress that this is all about the response on very long timescales. On human timescales the outlook is less bleak (see the short term comment on the right.)
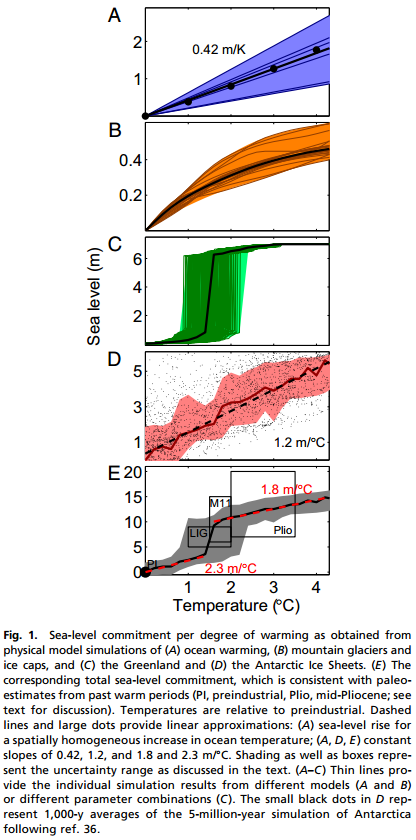
Levermann et al.:
!
Foster & Rohling:
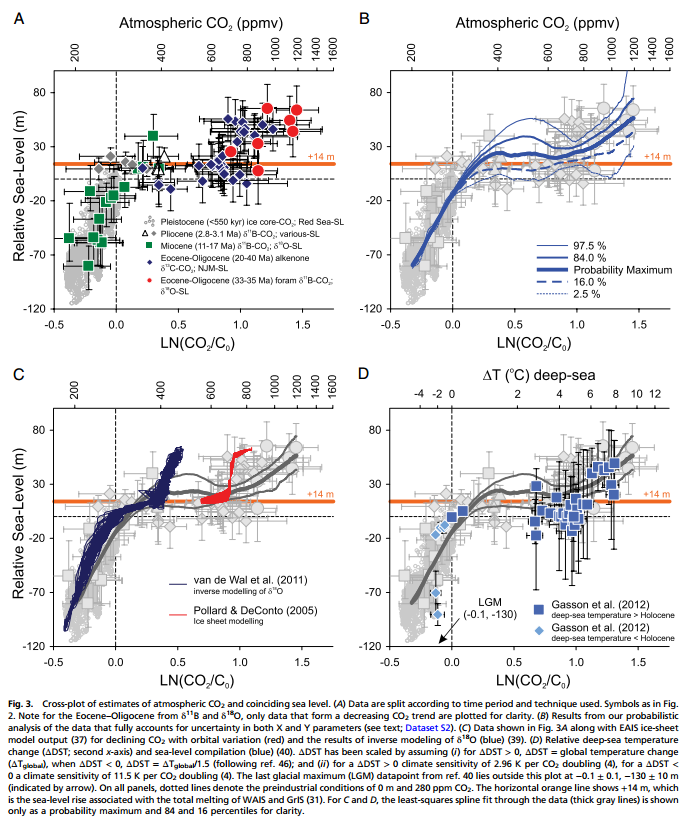
van de Wal et al.
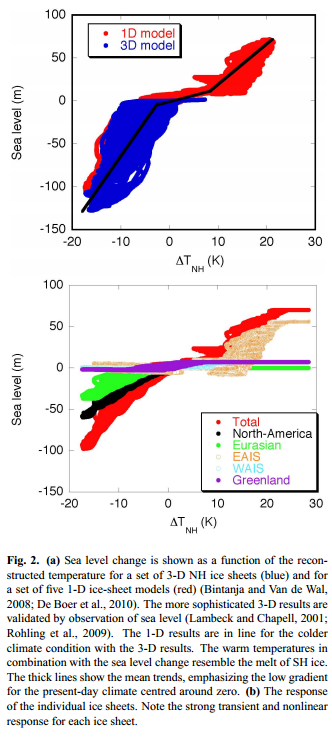
Finally something on the shorter term response.
Levermann et al. also shows the modelled response in shorter term (2millenia, so still long in human terms). One interesting thing is that even though there is a clear non-linear threshold for the Greenland ice sheet, then the effect of this has not really kicked in after 2k model years. This means we can expect a much more simple relationship between the rate of loss and warming if we only aim to make short term century scale projections. Further support for this idea can be found in the SeaRISE experiments where there is a near linearity between forcing and century average rate of loss (see Bindshadler). Also work by Ricarda Winkelmann and Levermann et al. supports this idea. This indicates that the ice sheet mass loss can be modelled using simple semi-empirical models (provided that you have good calibration data on century time scales, and can quantify the historical forcing).
Even more finally: here’s our 500 year semi-empirical projection of global sea level rise.
Regarding tectonics and deep past as an analogue for the future.
I have previously expressed a concern whether the deep past (e.g. Eocene) may be an inappropriate analogy for as the future as the presence/non-presence of ice sheets may also have been influenced by tectonics. I am also concerned with the vertical uncertainty over such long timescales. Nevertheless I consider the paleo records extremely valuable when thinking about future commitment. But be careful about the potential caveats and don’t over interpret the exact number of metres.