Reconstructing global sea level
Better estimates of historical Global Mean Sea Level (GMSL) can help us understand many components of climate system. It is a key climate record.
Apr 28, 2025
Better estimates of historical Global Mean Sea Level (GMSL) can help us understand many components of climate system. It is a key climate record.
Apr 28, 2025
Here is an illustration which may help to interpret changes in return period/return magnitude plots.
Sep 30, 2015
Jens Morten Hansen (JMH) and co-authors have recently published a study where they use sine-regression to fit 5 oscillations plus a linear trend to a 160-year sea level record from waters near Denmark …
Sep 25, 2015
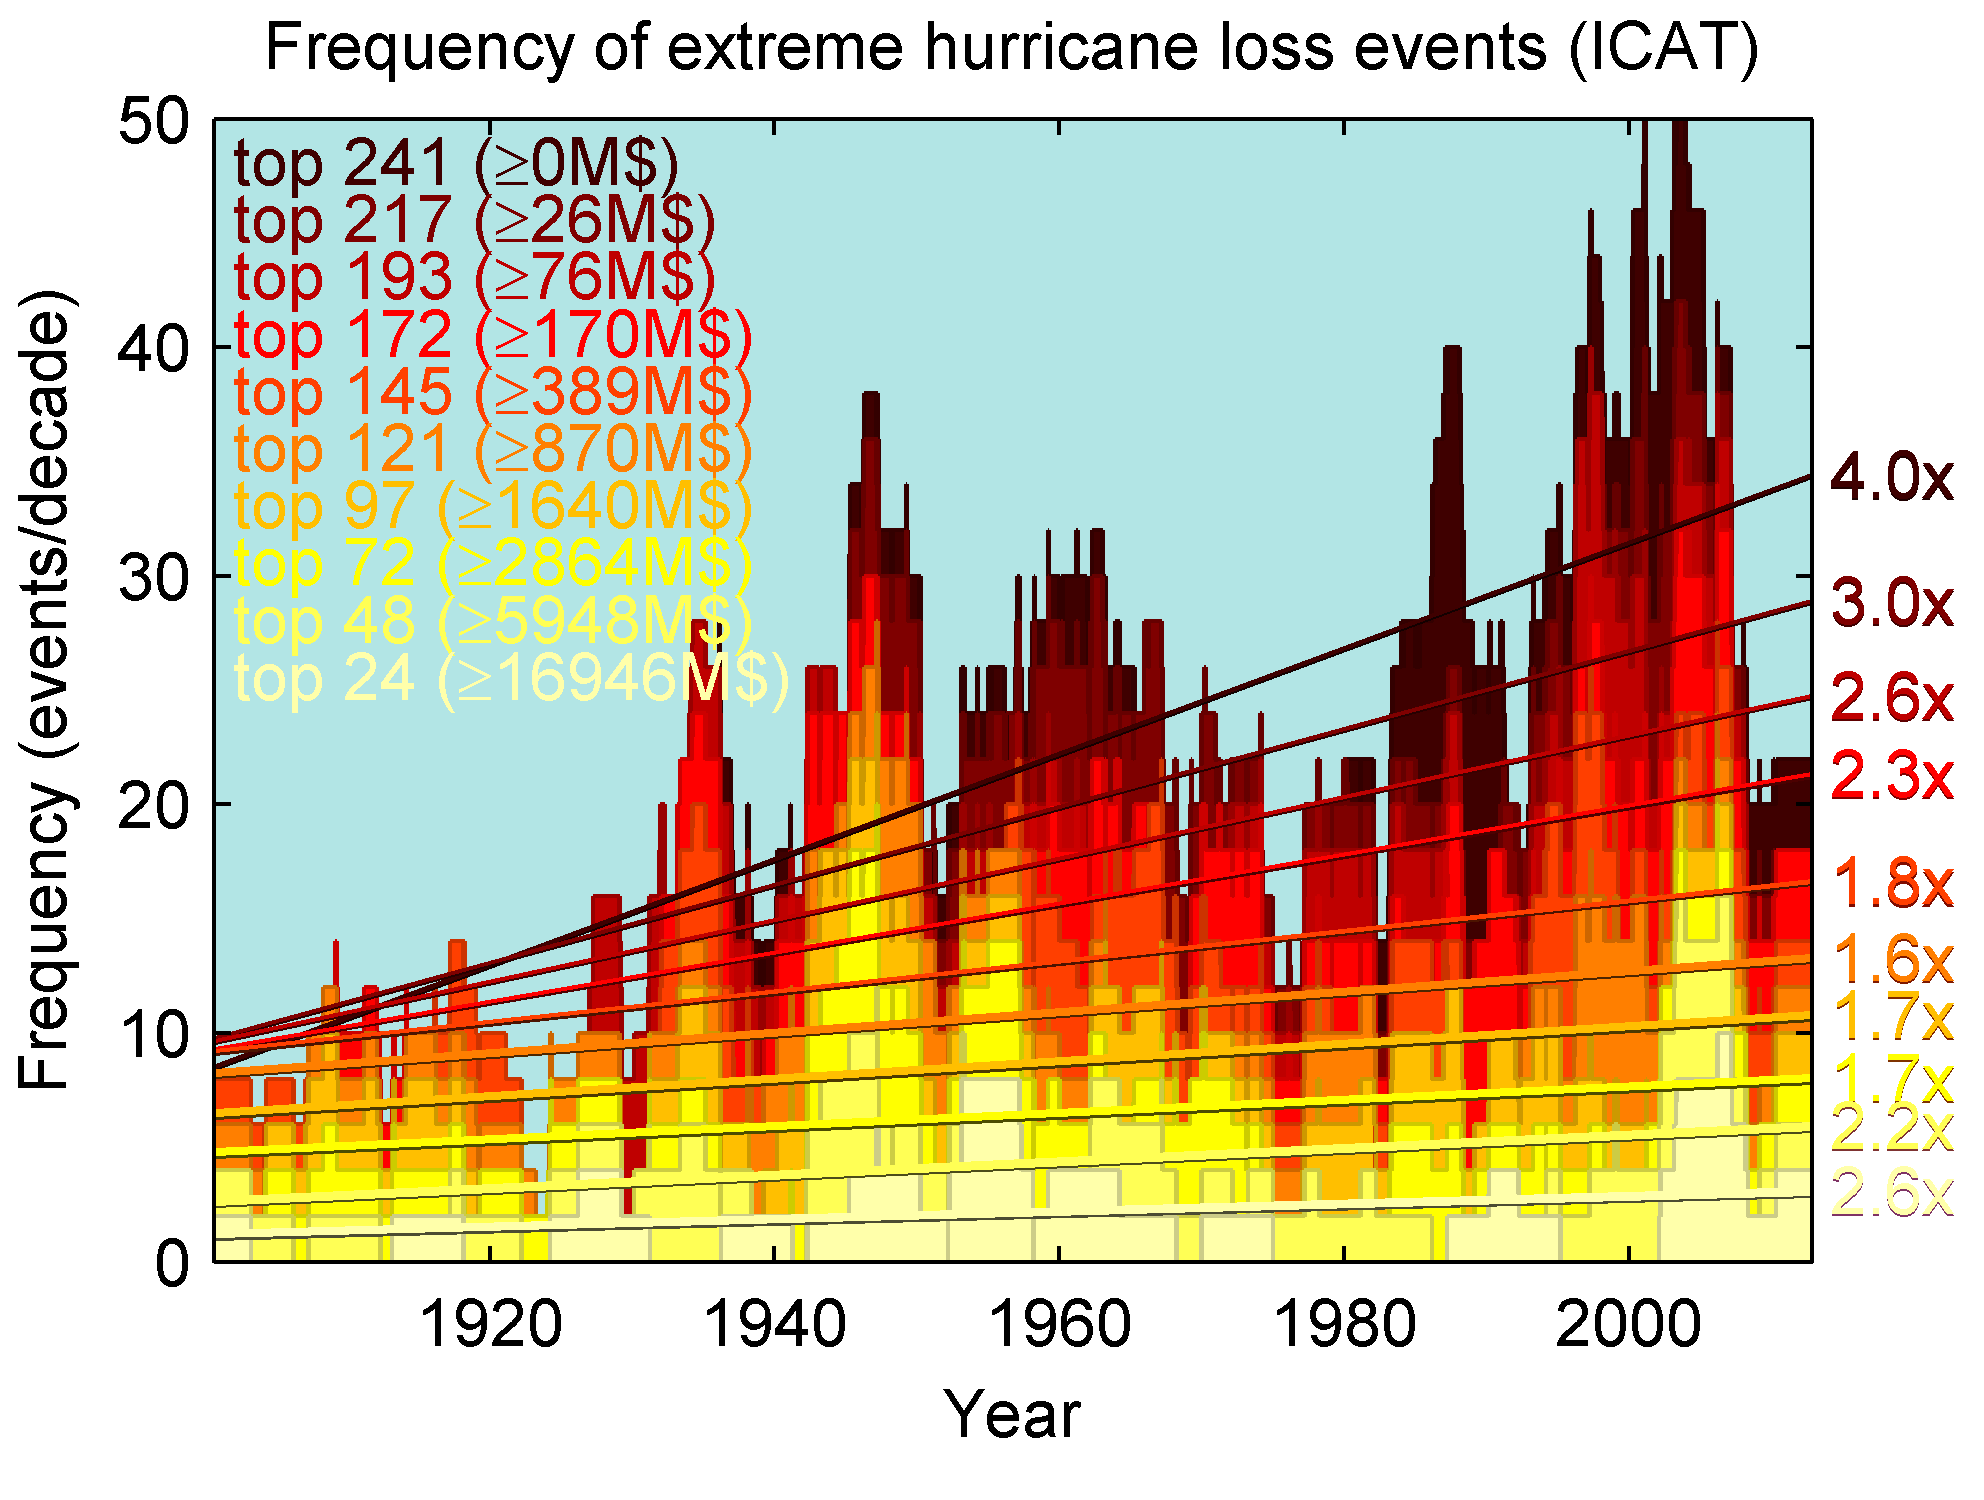
I have downloaded the ICAT damage estimates of normalized hurricane damages(/losses) and looked at the trends in the data. This series is often used to argue that there is no significant trend in …
Nov 20, 2013
Before we can trust the projected models of sea level rise then it is reasonable to demand that these models can match the record of global mean sea level rise. Gregory et al. (2012) writes: …
Nov 20, 2013
Well, it is more likely than it decreased the odds.
Jul 30, 2013
Greenhouse gases is warming the world and this will lead to more frequent heat waves all else being equal. You might naively think that this increase in extreme warm spells will be compensated by an …
Jun 24, 2012
Jevrejeva, S., J. C. Moore, and A. Grinsted (2003), Influence of the Arctic Oscillation and El Niño-Southern Oscillation (ENSO) on ice conditions in the Baltic Sea: The wavelet approach, J. Geophys. …
Dec 24, 2003