Compiling multiple markdown files to epub
I’ve been experimenting with different ways of converting a whole folder of obsidian markdown files to epub using pandoc. Here are some different options that I’ve explored. The longform …
Aug 25, 2025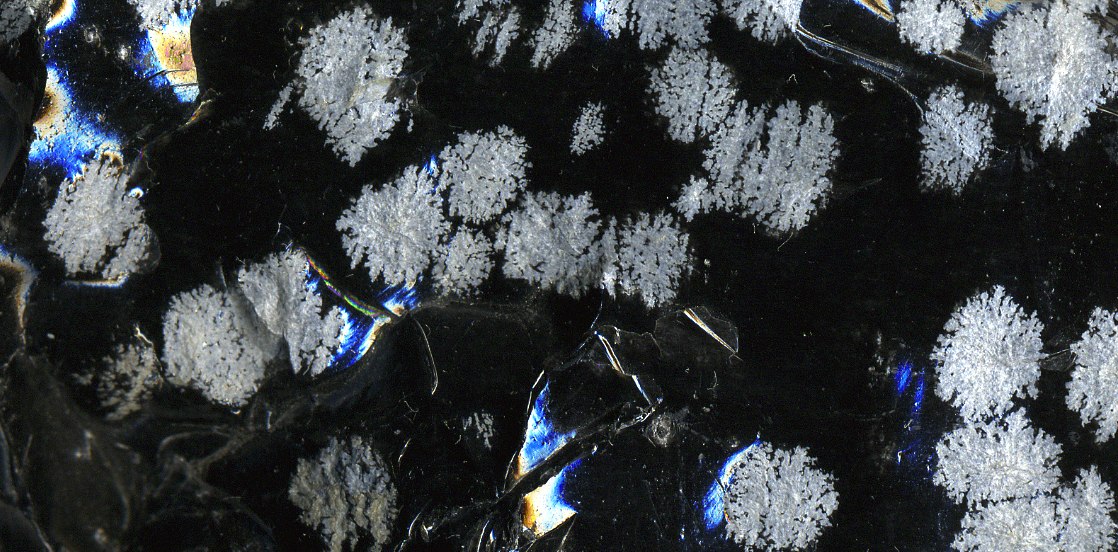
I’ve been experimenting with different ways of converting a whole folder of obsidian markdown files to epub using pandoc. Here are some different options that I’ve explored. The longform …
Aug 25, 2025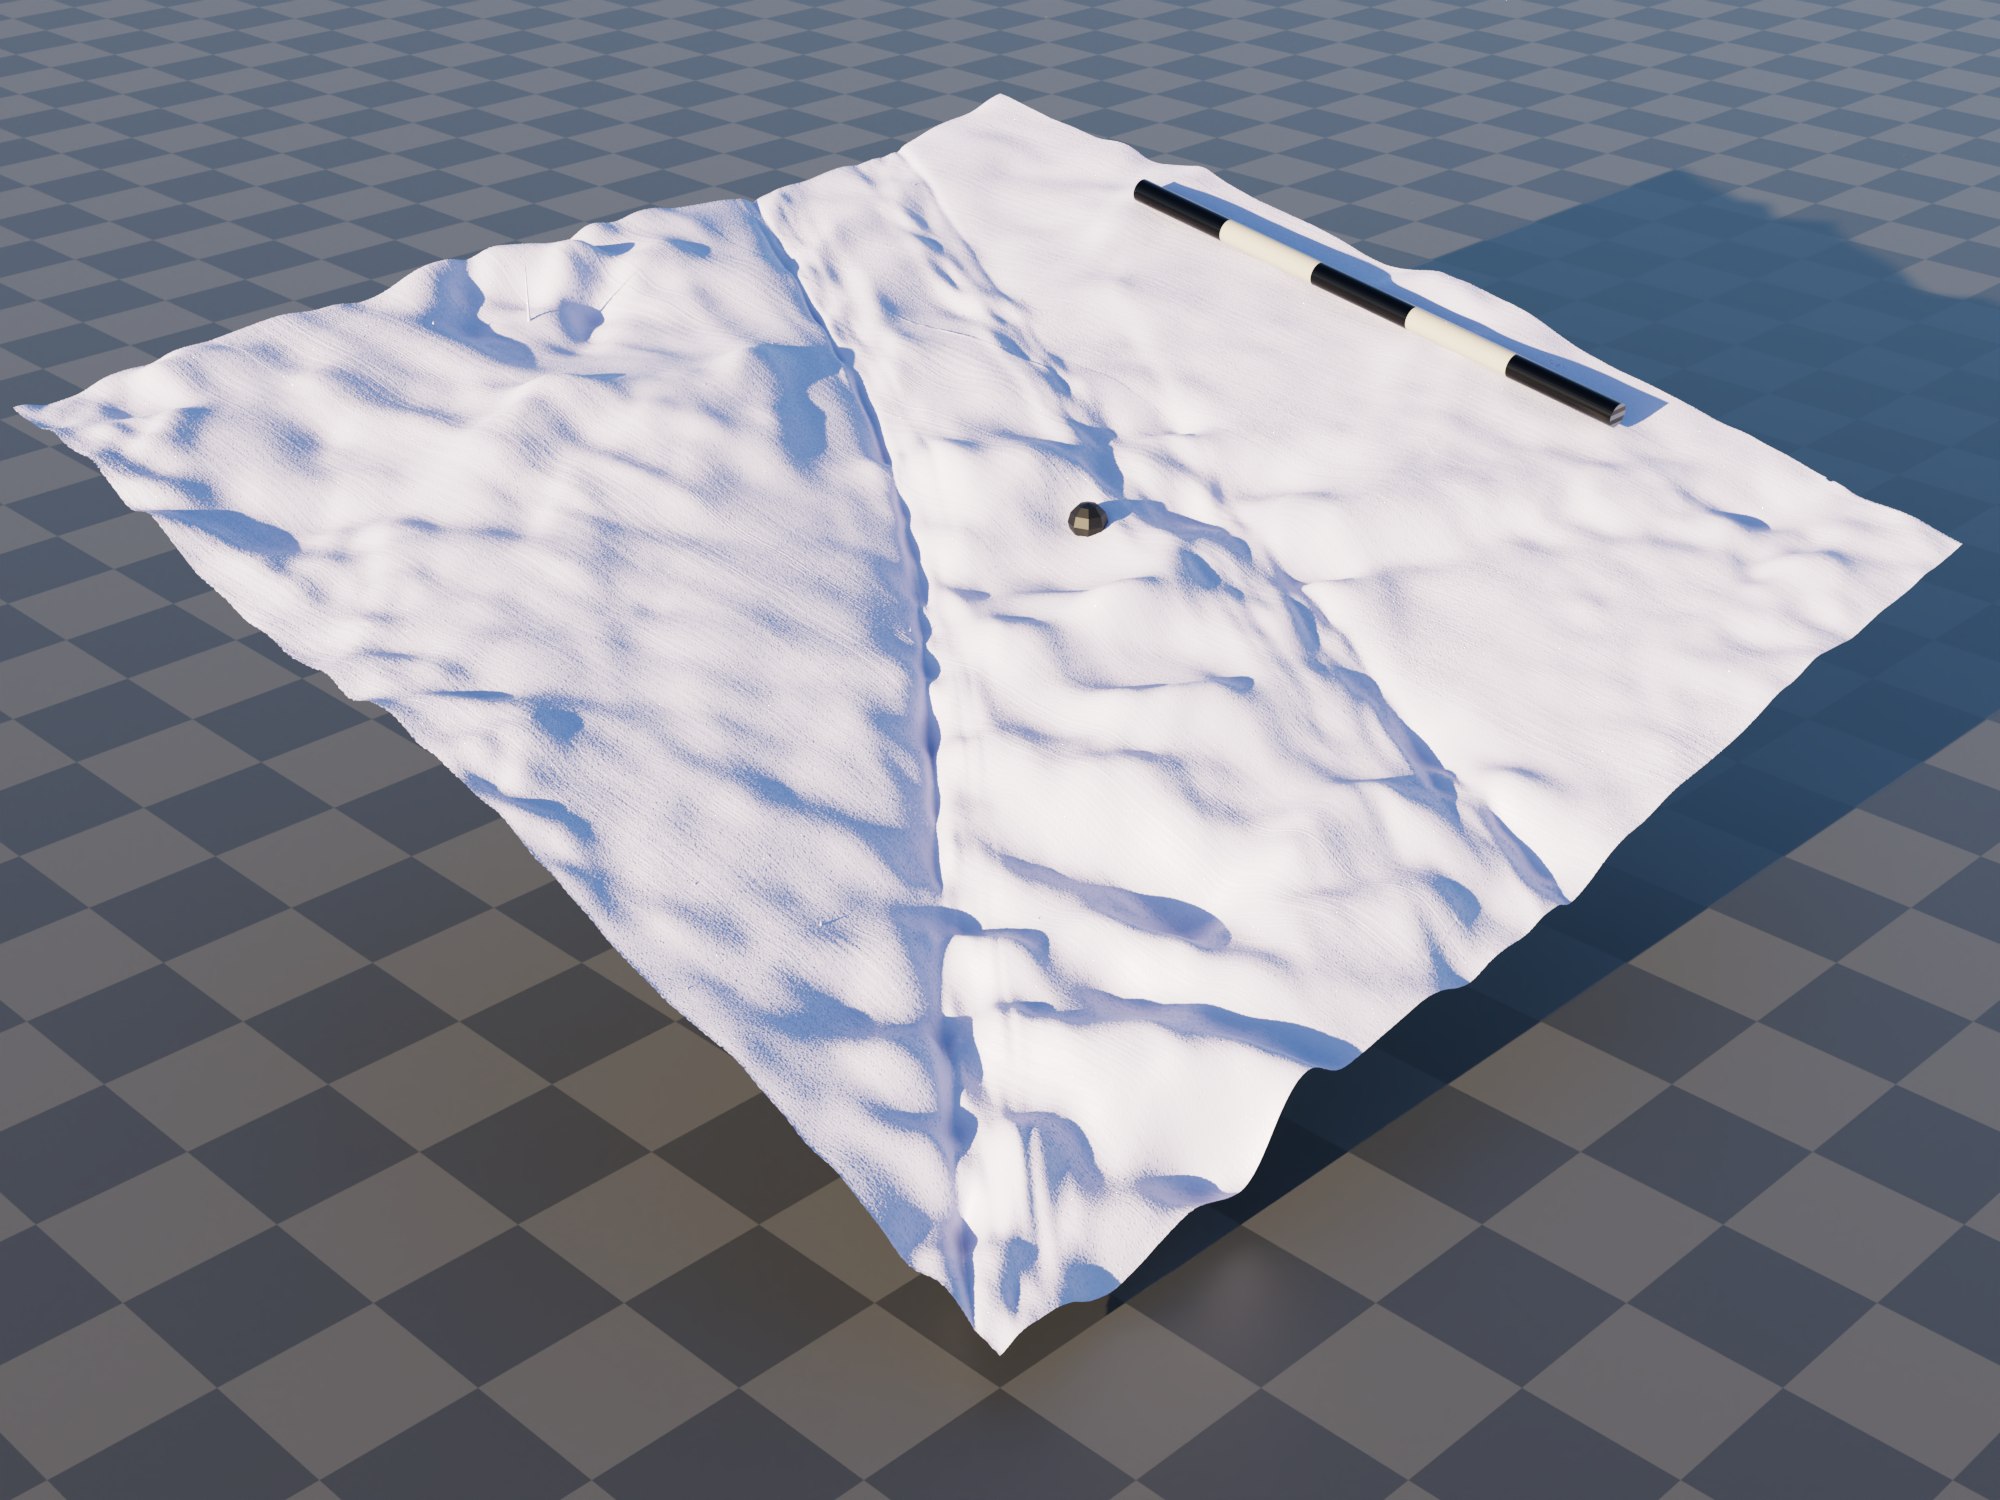
Here are some personal notes for how to make elevation models using Blender. install the BlenderGIS plugin. (optional) import geotiff with import using geotiff “DEM as a displacement …
Feb 1, 2024
FEniCS is a really nice tool for finite element modelling in python. It is difficult to install FEniCS on windows. The official instructions use a docker image. which I think is a bit heavy handed. I …
Mar 25, 2022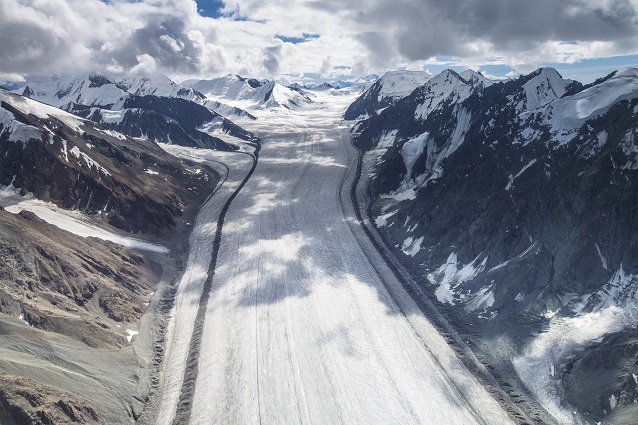
dailyglacier is a twitter-bot that tweets images of a random glacier every day. This page is used to display additional metadata and maps from the bot. Metadata: Metadata refers to the glacier at the …
Sep 25, 2017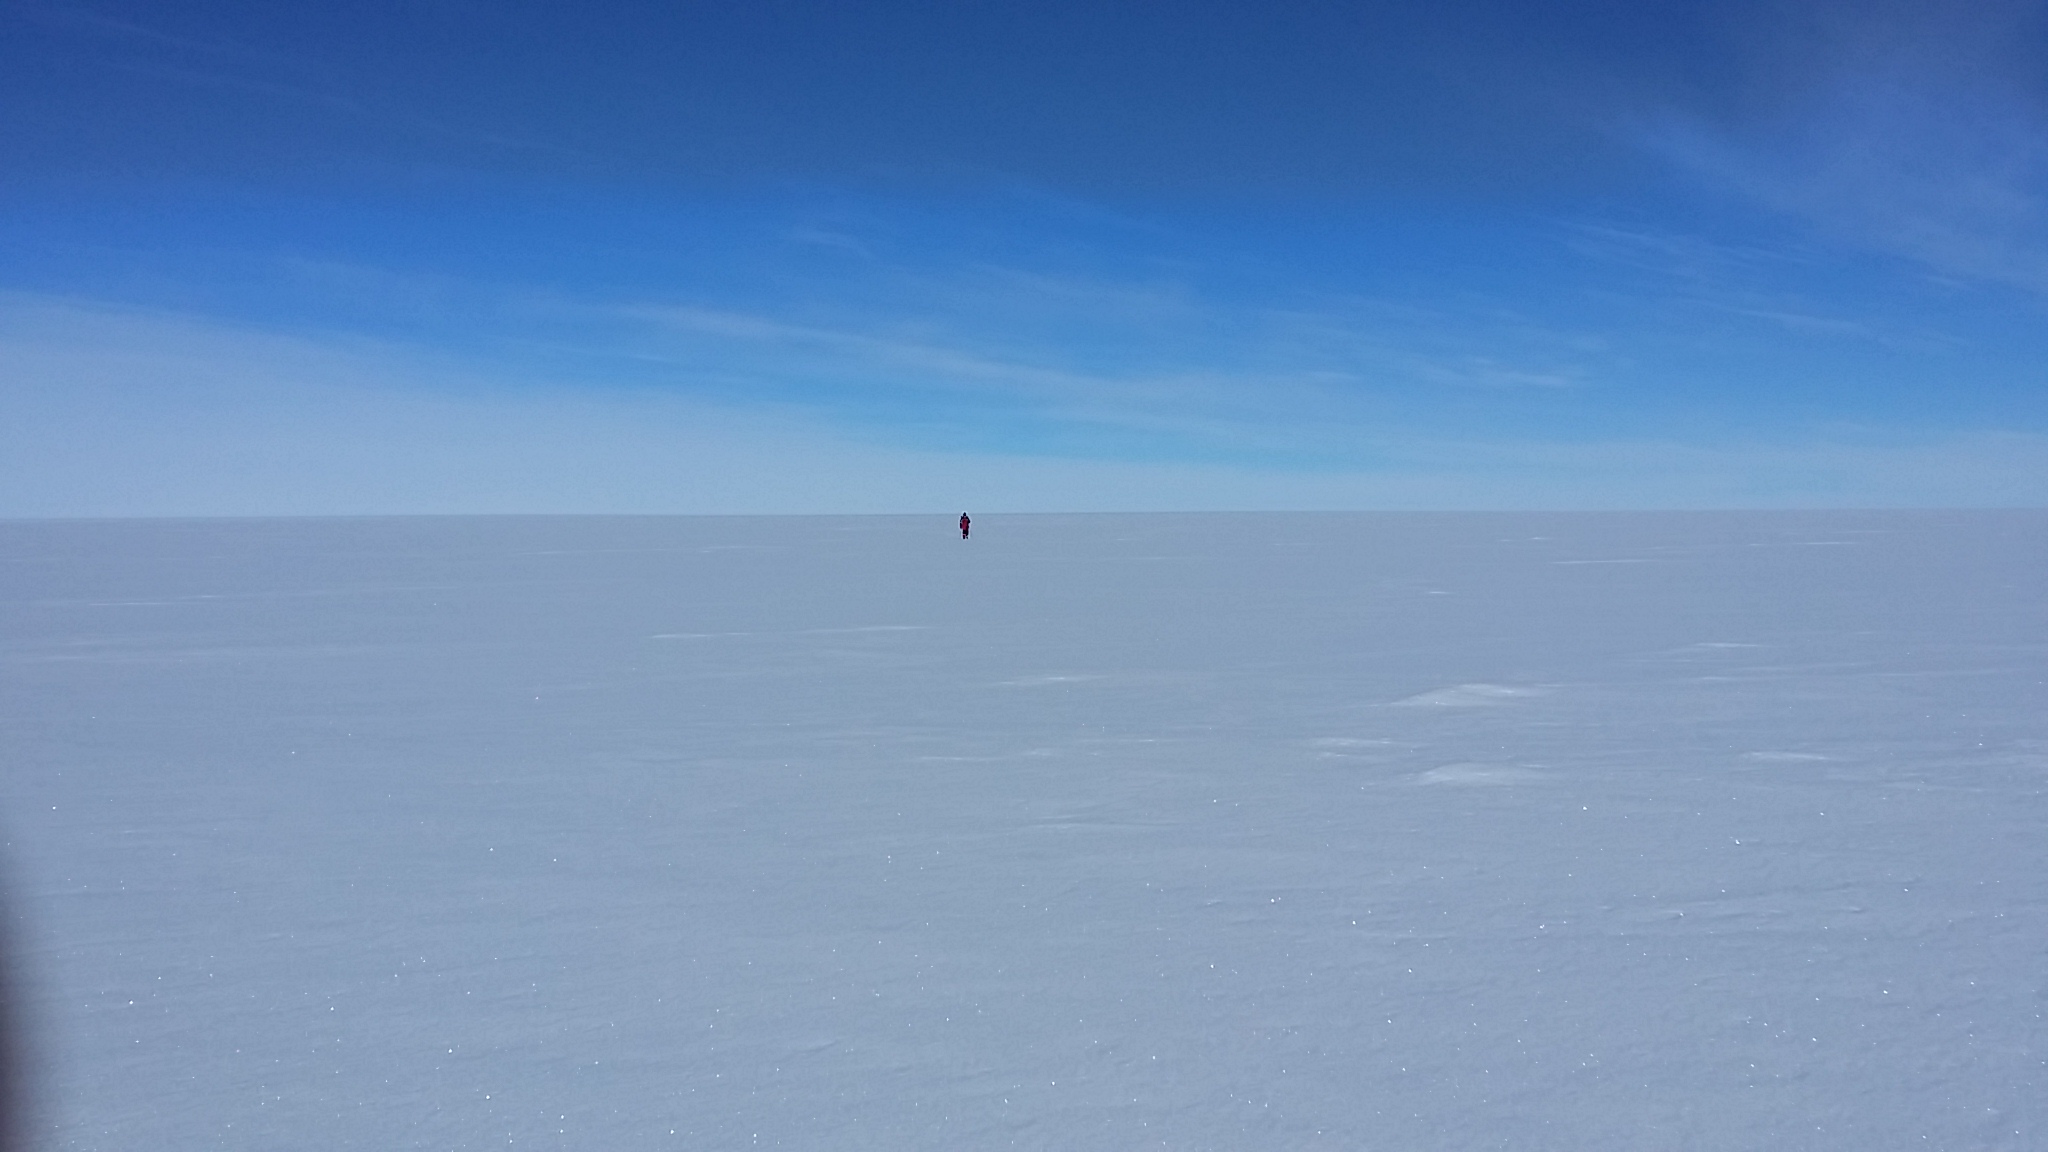
This summer I’ve been doing fieldwork at Eastgrip, doing a GPS survey of a stake strain network, and mapping the surroundings with a fixed wing drone. But I also found some time to compose a …
Aug 11, 2016
I am working with satellite imagery in Matlab. This is way too much data for me to keep on my laptop, and so I keep it on a server somewhere. But this has the major drawback that I cannot as easily …
May 29, 2016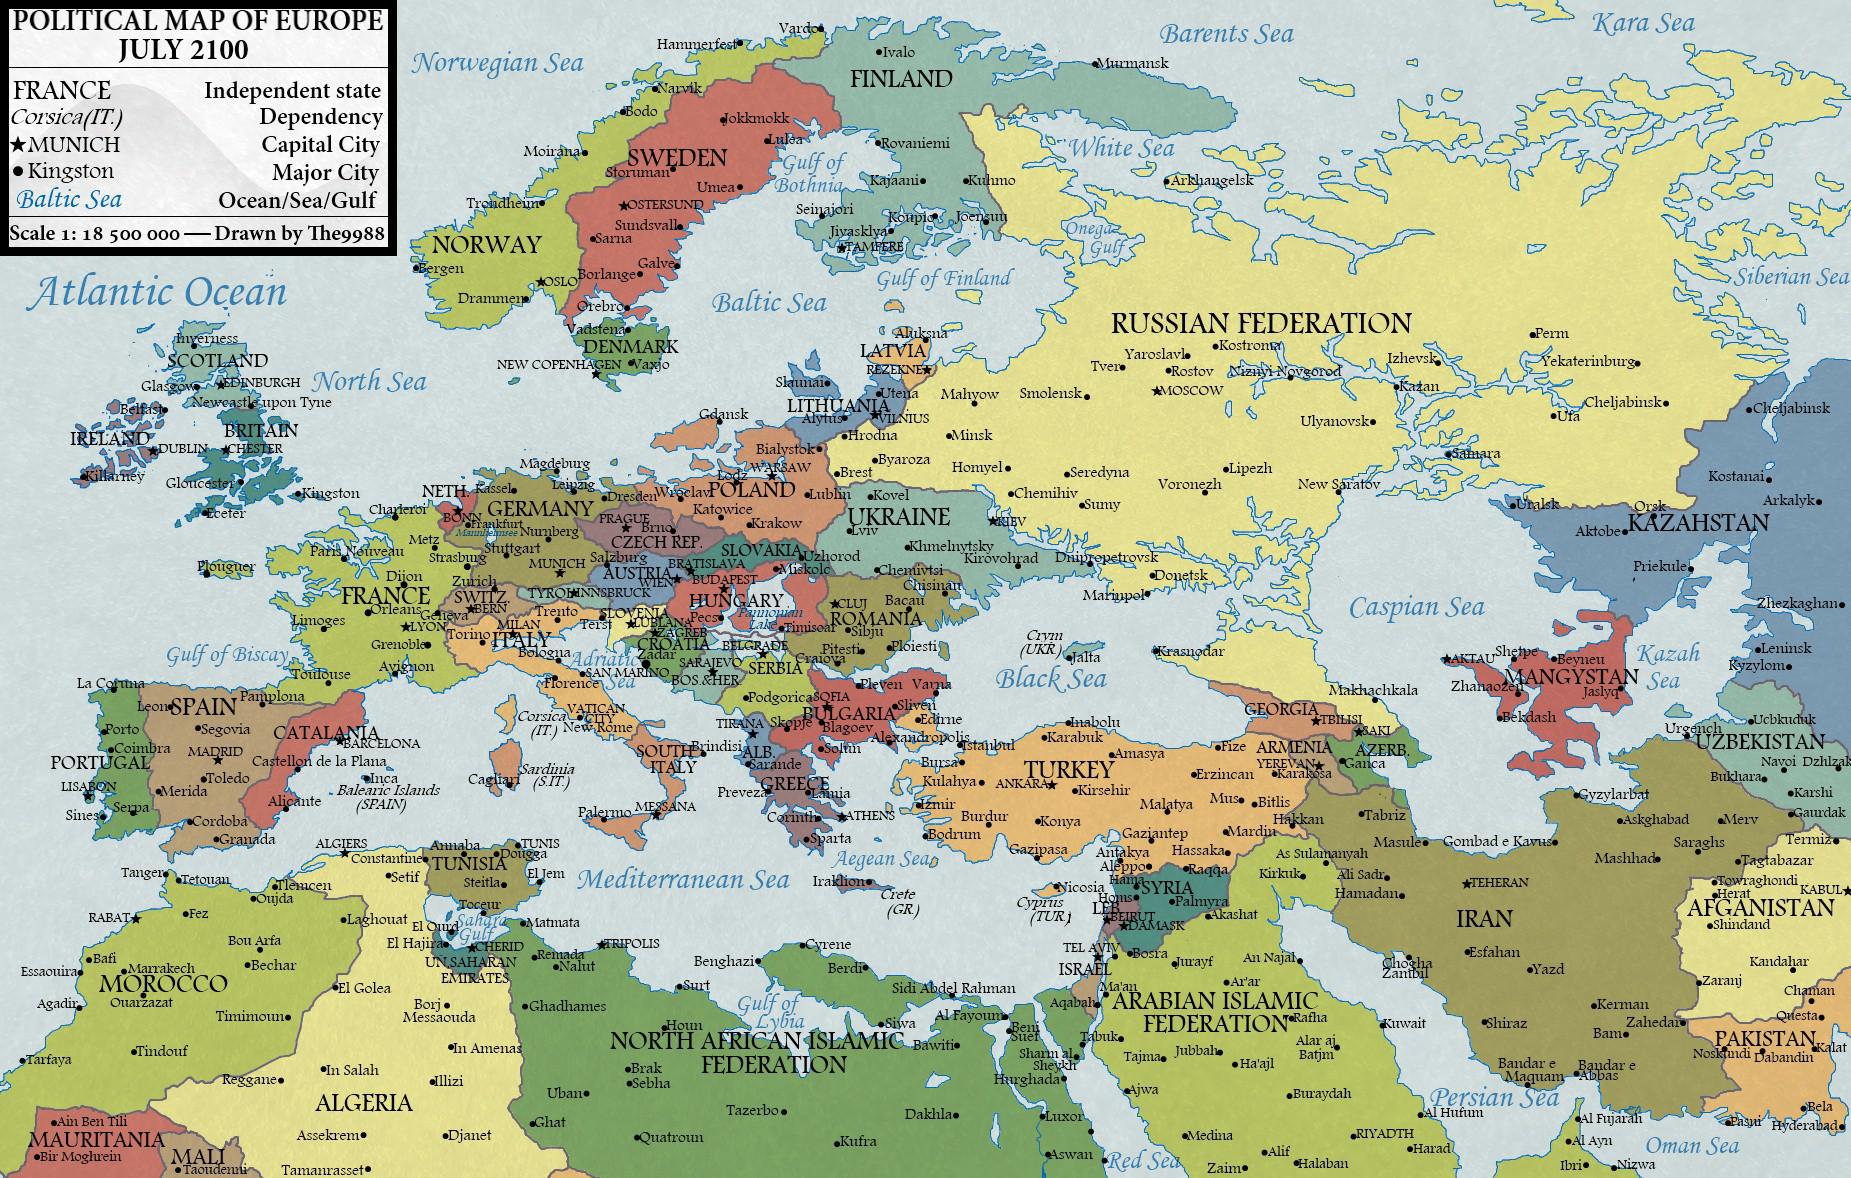
We may be committing ourselves to an eventual complete deglaciation of Earth in a business-as-usual scenario (ECP8.5). The sea level rise from a complete deglaciation would wipe my own country, …
Mar 15, 2016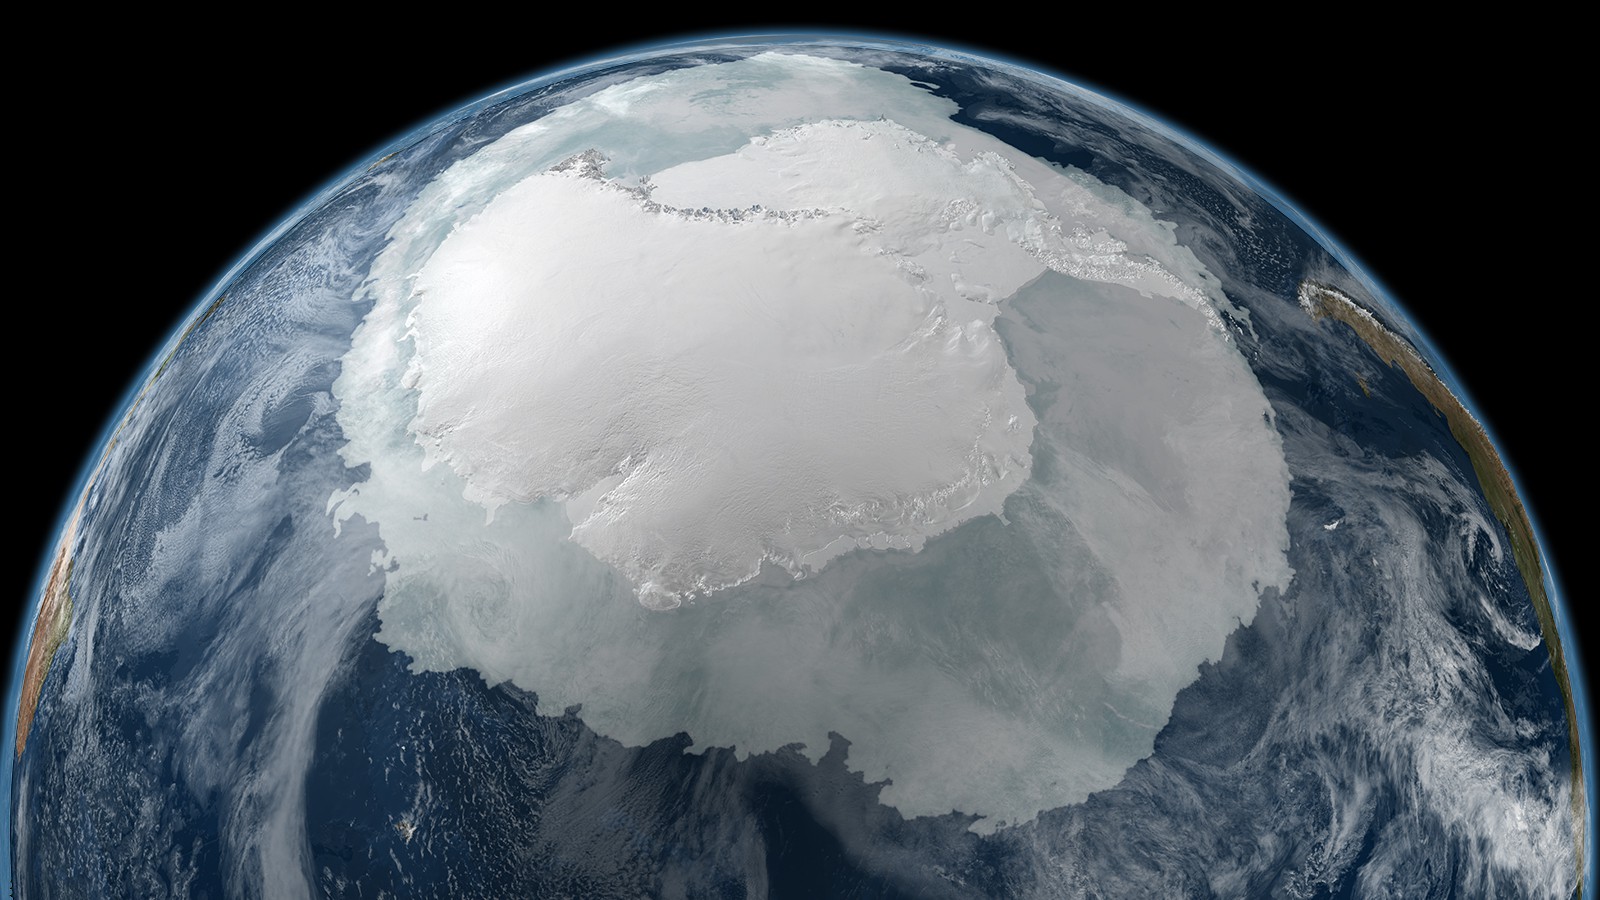
Ritz et al. (2015) have a recent model study of potential sea level rise from Antarctic marine ice sheet instability.
Dec 15, 2015
Take away message: The graph on the right shows that AR5 process based ice sheet projections are optimistic and over confident when compared to views of ice sheet experts. To be fair they do mention a …
Oct 8, 2015
Here is an illustration which may help to interpret changes in return period/return magnitude plots.
Sep 30, 2015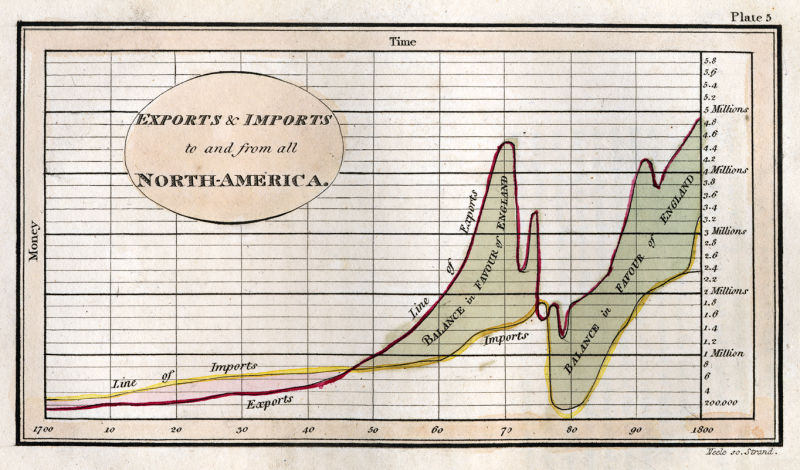
I recommend using inkscape if you want to digitize a vector figure from a pdf file. Here’s how you do that.
Sep 30, 2015
Jens Morten Hansen (JMH) and co-authors have recently published a study where they use sine-regression to fit 5 oscillations plus a linear trend to a 160-year sea level record from waters near Denmark …
Sep 25, 2015