Three views on sea level commitment
Three recent papers on long term sea level commitment:
Aug 26, 2015
Three recent papers on long term sea level commitment:
Aug 26, 2015
In the austral summer 2006/07 i was part of an ~100 day expedition to Scharffenbergbotnen, Heimefrontfjella, Antarctica with FINNARP. There we collected a ~2.5km long horizontal ice core. We kept a …
Jun 24, 2015
Bamber and Aspinall 2013 published a formal expert elicitation on the future of our two ice sheets, and found a large spread between individual expert answers. It has been argued by them, and others …
May 27, 2015
Bamber and Aspinall (2013) carried out an expert elicitation of ice sheet experts. From this they could derive uncertainty ranges of the rate of mass loss from each ice sheet in 2100. In order to …
May 6, 2015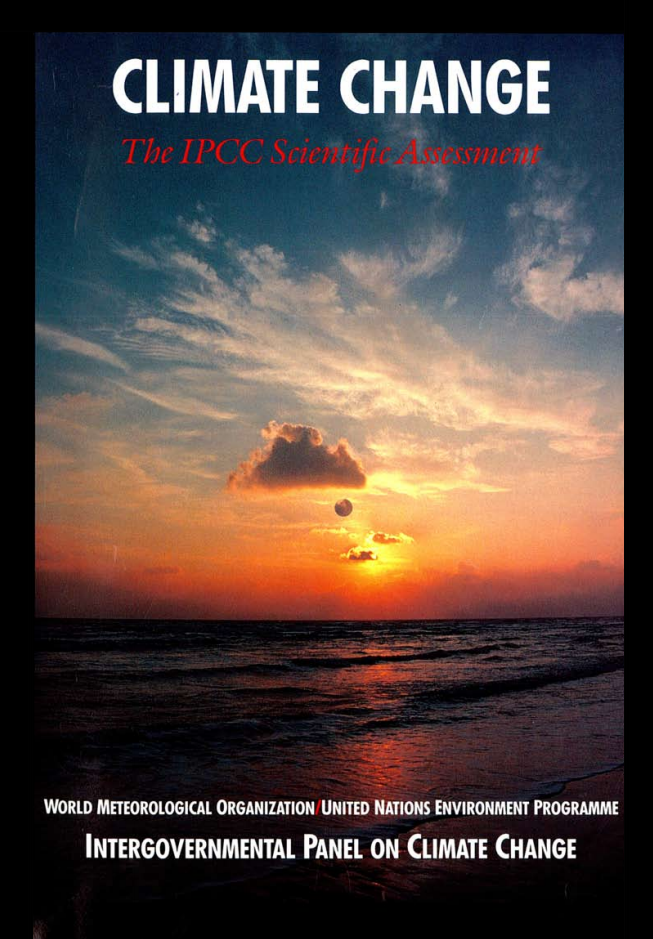
I have extracted some quotes from the IPCC reports since 1990 showing how West Antarctic Ice Sheet collapse has been discussed over time. It is not an exhaustive list.
Jan 7, 2015This is an updated version of the regularized global glacier volume estimates from Cogley (2012). I have included 2 new estimates: one by myself (G13) and another from Huss and Farinotti (HF12). These …
Nov 10, 2014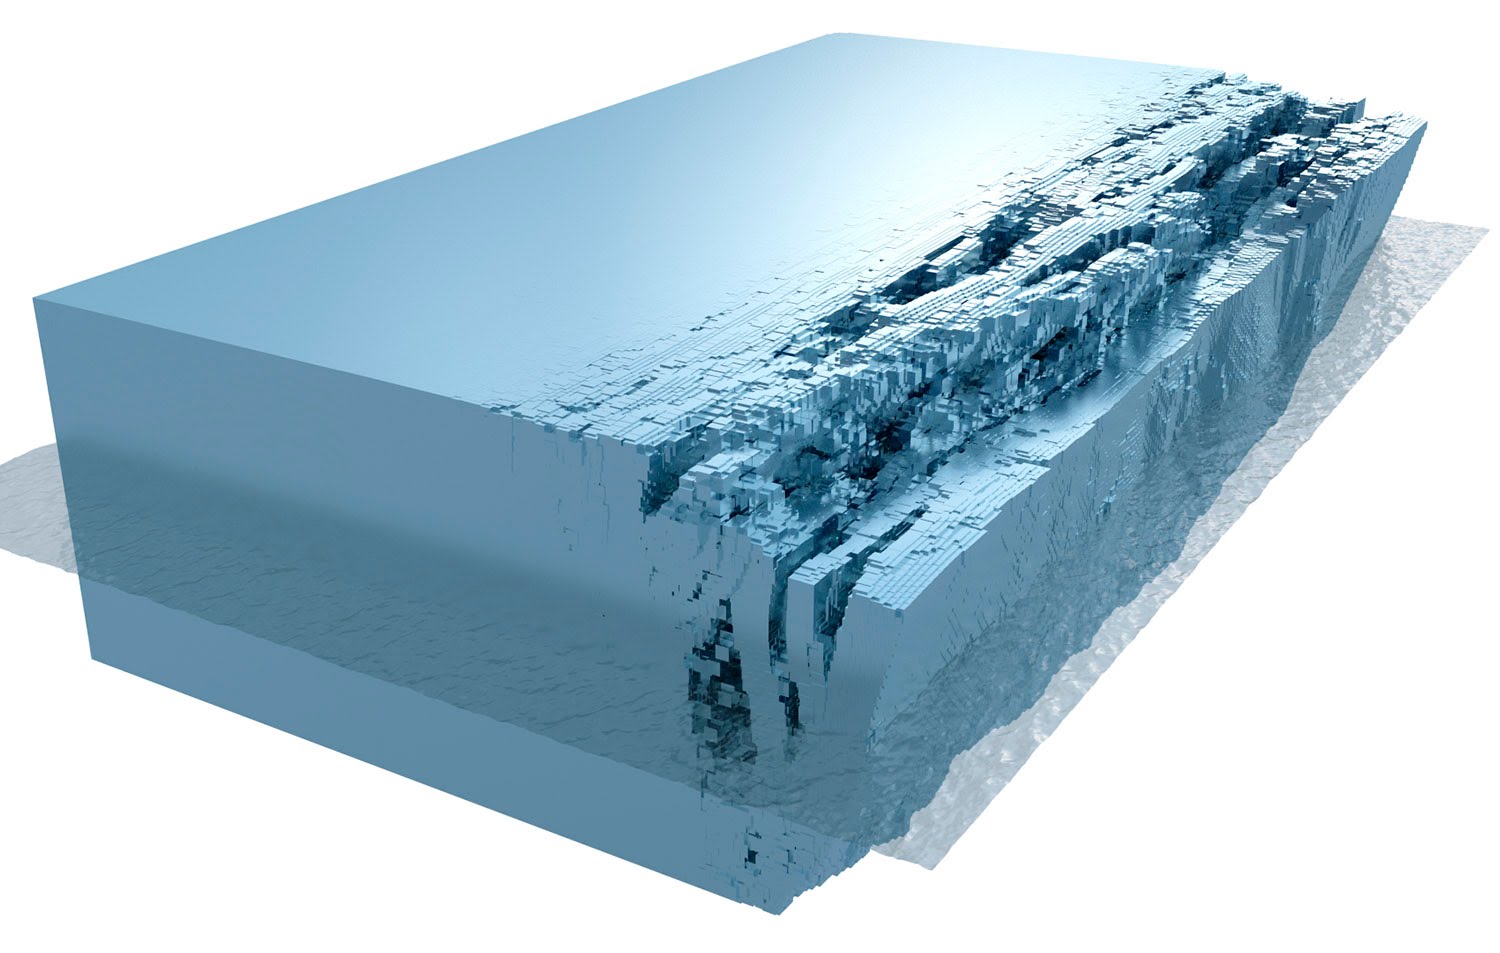
Should we take the risk of Antarctic collapse seriously? The IPCC AR5 sea level chapter considered instability of marine-based sectors of the ice sheets to be unlikely (Church et al., 2013). However, …
Nov 3, 2014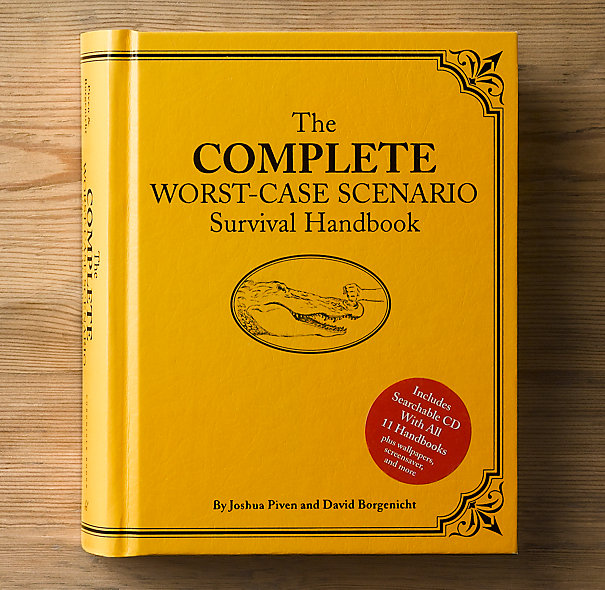
I am disappointed in how the sea level rise projection uncertainties are presented in the IPCC AR5. The way the numbers are presented makes people believe 98 cm by 2100 is a worst-case scenario which …
Oct 23, 2014
It can be quite difficult to interpret what likely exactly means sometimes. For example in the AR5 sea level chapter they report a likely range of 21-33 cm for thermal expansion (RCP8.5 table 13.5). I …
May 14, 2014
Me at EGU 2014:
Apr 16, 2014
El Nino is not well represented by many climate models.
Feb 27, 2014
Global average calorie intake is: 2940 kCal/capita/day. We are 7 billion people on Earth.
Dec 2, 2013